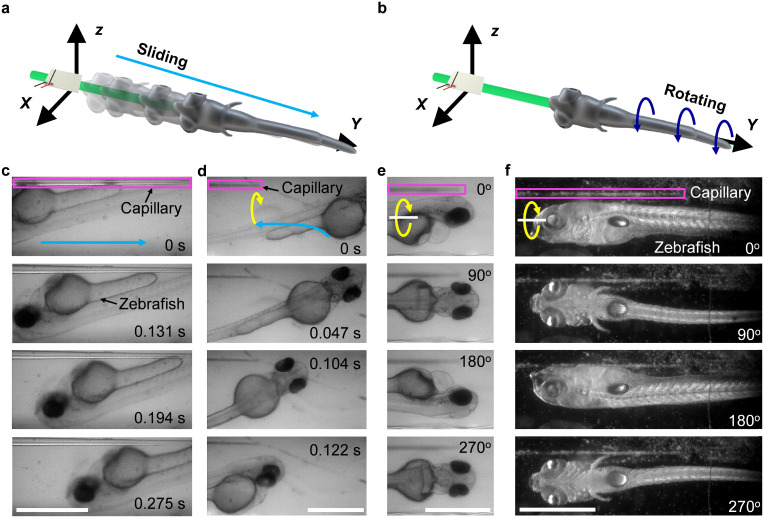
Fig. 5 Trapping and rotation of zebrafish larvae. a) Schematic of zebrafish trapping. b) Schematic of zebrafish rotation. c) A zebrafish larva is trapped and slides down the glass capillary toward the tip. d) A zebrafish larva in front of the capillary is trapped and slides toward the tip. The light-blue lines denote the trajectories of the trapped zebrafish larvae. e) Multiple view angles of a rotating 4 dpf zebrafish larva. Ultrasound excitation frequency and voltage were 185 kHz and 12 VPP, respectively. f) Multiple view angles of a rotating 8 dpf zebrafish larva. Ultrasound excitation frequency and voltage were 185 kHz and 15 VPP, respectively. Yellow curves show the rotating directions. The magenta box denotes the vibrating capillary. Scale bar, 500 μm.
Image
Figure Caption
Acknowledgments
This image is the copyrighted work of the attributed author or publisher, and
ZFIN has permission only to display this image to its users.
Additional permissions should be obtained from the applicable author or publisher of the image.
Full text @ Lab Chip

