IMAGE

Fig. 2.

ID
ZDB-IMAGE-240211-50
Source
Figures for Torraca et al., 2023
Image
Figure Caption

Fig. 2.

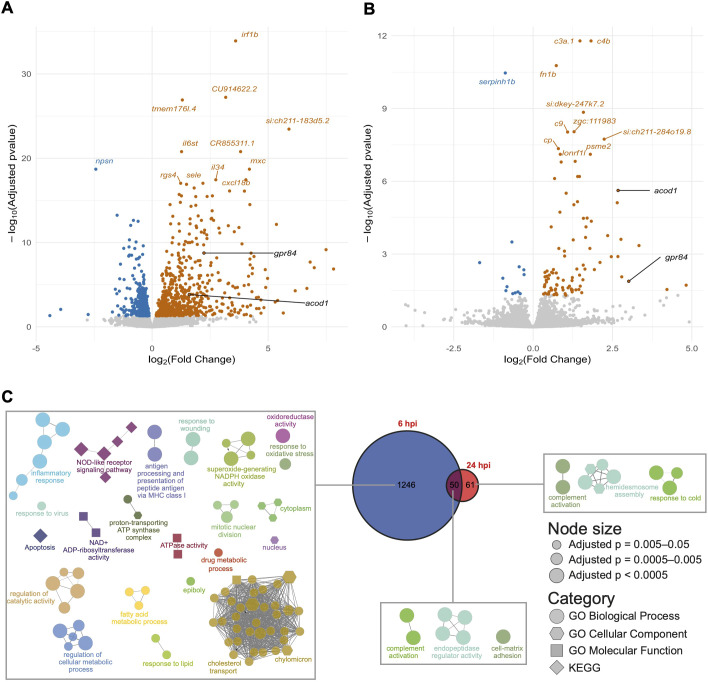
Analysis of differentially expressed genes in S. flexneri-injected embryos. (A,B) Volcano plots of differentially expressed genes between embryos infected with S. flexneri and mock-injected at 6 hpi (A) and 24 hpi (B). Each point represents a gene, -log10(adjusted P value) is plotted on the y-axis and log2(fold change) on the x-axis. Upregulated genes are coloured in orange and downregulated genes in blue. Genes with the highest -log10(adjusted P value) are labelled. gpr84 and acod1 are highlighted in black as these genes were further pursued for functional characterisation for a role in susceptibility to infection. (C) Gene ontology (GO) term enrichments. Network diagrams of GO term enrichments for genes differentially expressed at 6 hpi only (left), 24 hpi only (right) and both 6 and 24 hpi (middle). Each node in the diagrams represents an enriched GO term, and terms are connected to terms that share annotated genes. This clusters the terms into process-related groups. The Venn diagram shows the numbers of differentially expressed genes at each timepoint and the overlap.

Acknowledgments
This image is the copyrighted work of the attributed author or publisher, and ZFIN has permission only to display this image to its users. Additional permissions should be obtained from the applicable author or publisher of the image. Full text @ Dis. Model. Mech.