
Image
|
Figure Caption
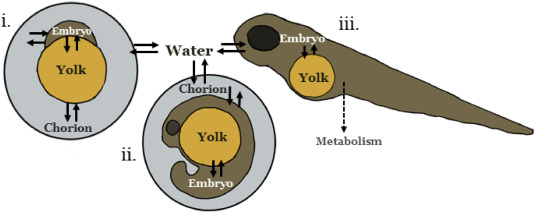
Fig. 1 Structure of the TK model represented for three developmental stages: i) between 0% until 100% epiboly (around 10 hpf) ii) between around 10 hpf until hatching (60 hpf), and iii) > 60 hpf hatching. Arrows represent mass flow of compound between compartments.
Acknowledgments
This image is the copyrighted work of the attributed author or publisher, and
ZFIN has permission only to display this image to its users.
Additional permissions should be obtained from the applicable author or publisher of the image.
Full text @ Chemosphere