Image
Figure Caption
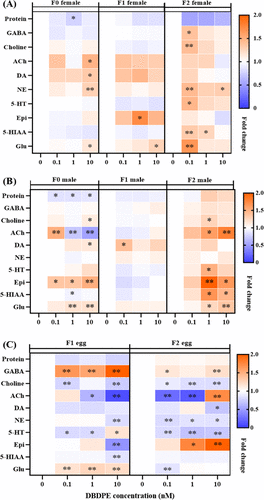
Fig. 3 Changing profiles of protein and neurotransmitters in the brains of (A) female, (B) male zebrafish, and (C) in the eggs. *P < 0.05 and **P < 0.01 indicate significant differences between exposure groups and corresponding control group. GABA: γ-aminobutyric; ACh: acetylcholine; DA: dopamine; NE: norepinephrine; 5-HT: serotonin; Epi: epinephrine; 5-HIAA: 5-hydroxyindoleacetic acid; Glu: glutamate. The blue indicates down-regulation, while the orange indicates up-regulation, and the color intensity is proportional to the magnitude of changes.
Acknowledgments
This image is the copyrighted work of the attributed author or publisher, and
ZFIN has permission only to display this image to its users.
Additional permissions should be obtained from the applicable author or publisher of the image.
Full text @ Env. Sci. Tech.

