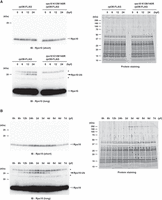
Fig. 6 Rps10/eS10 ubiquitination level temporally changes during development. (A) Detection of Rps10/eS10 ubiquitination from 0 to 24 hpf embryos. FLAG-IPs were subjected to immunoblotting analysis with an anti-Rps10 antibody (left) and protein staining (right). The developmental time points are indicated above as hpf. White and black arrowheads indicate nonubiquitinated or ubiquitinated Rps10/eS10 signals, respectively. Asterisks indicate nonspecific signals. (B) Detection of Rps10/eS10 ubiquitination during development. FLAG-IPs were subjected to immunoblotting analysis with an anti-Rps10 antibody (left) and protein staining (right). The developmental time points are indicated above as hpf or dpf. White and black arrowheads indicate nonubiquitinated or ubiquitinated Rps10/eS10 signals, respectively. Asterisks indicate nonspecific signals.
Image
Figure Caption
Acknowledgments
This image is the copyrighted work of the attributed author or publisher, and
ZFIN has permission only to display this image to its users.
Additional permissions should be obtained from the applicable author or publisher of the image.
Full text @ RNA

