IMAGE

Fig. 7.

ID
ZDB-IMAGE-240129-251
Source
Figures for Olson et al., 2024
Image
Figure Caption

Fig. 7.

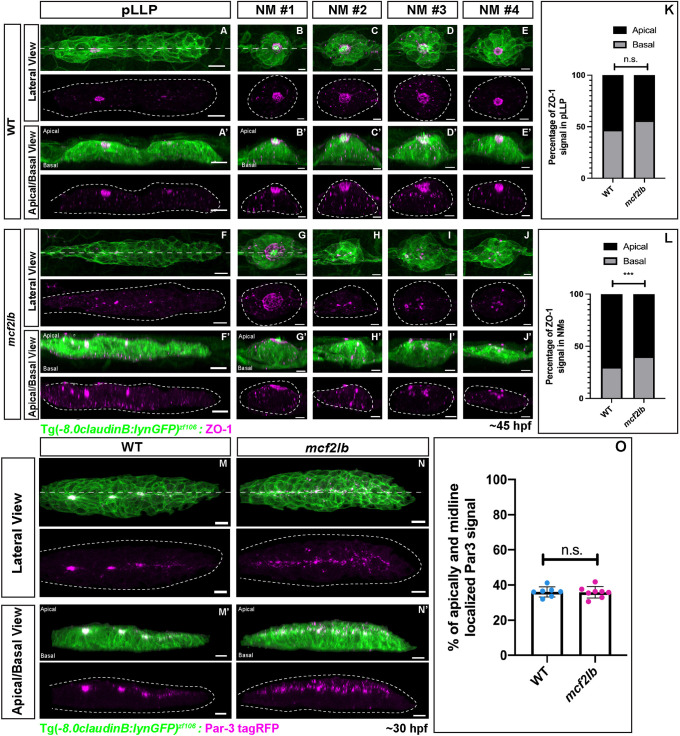
pLLP cell polarity is largely unaffected in mcf2lb mutants. (A-J′) Immunostaining for the tight junction marker ZO-1 in WT and mutant pLLPs at 45 hpf. Panels A-J show the lateral (top-down) view, A′-J′ show an apical-basal view (images were digitally rotated 90° around x-axis; dashed lines in A,B,F,G). All images are z-projections. Dotted lines indicate the pLLP in B and F and NMs in B-E and G-J. Note the ring structure and the apical localization of ZO-1 in the trailing-most rosette and deposited NMs in WT. In contrast, ZO-1 signal is disorganized in mc2lb mutants. (K) Quantification of the percentage of apical- and basal-localized ZO-1 signal in the pLLP in WT (n=8 pLLPs) and mcf2lb mutants (n=13 pLLPs). (L) Quantification of the percentage of apical- and basal-localized ZO-1 signal in NMs in WT (n=15 NMs from four embryos) and mc2lb mutants (n=26 NMs from five embryos). (M-N′) Par-3-tagRFP expression in WT and mcf2lb mutant pLLPs. Panels M and N show the lateral (top-down) view, panels M′ and N′ show an apical-basal view (images were digitally rotated 90° around x-axis; dashed lines M,N). All images are z-projections. Note Par-3 localization to the rosette centers and the midline in WT embryos; in contrast, Par-3 is localized to the midline but not organized into rosette centers in mcf2lb mutants. Par-3 is apically localized in both WT and mcf2lb mutant pLLPs. (O) Quantification of the percentage of apically- and midline-localized Par-3 signal in WT (n=7 pLLPs) and mcf2lb mutants (n=8 pLLPs). ***P<0.001 (unpaired two-tailed t-test). n.s., not significant. Error bars are s.d. Scale bars: 10 μm (A,F,M,N); 5 μm (B-D,G-J).

Acknowledgments
This image is the copyrighted work of the attributed author or publisher, and ZFIN has permission only to display this image to its users. Additional permissions should be obtained from the applicable author or publisher of the image. Full text @ Development