IMAGE

Fig. 2.

ID
ZDB-IMAGE-240129-247
Genes
Source
Figures for Olson et al., 2024
Image
Figure Caption

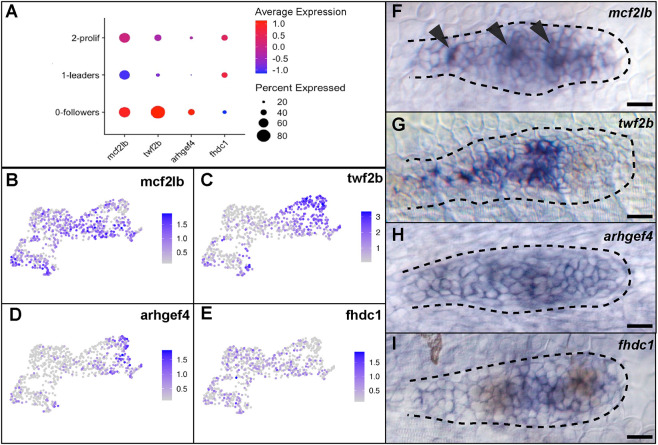
Fig. 2.

Expression profile of genes that regulate actin dynamics. (A) Dot plot expression profile of mcf2lb, twf2b, arhgef4 and fhdc1. (B-E) Feature plots showing expression profile of the above four genes in pLLP clusters. (F-I) In situ hybridization of the four genes. Note that expression profiles via in situ hybridization largely match those observed by scRNA-seq. Arrowheads indicate rosette centers. Dotted lines indicate the outline of the pLLP. Scale bars: 10 μm.

Figure Data
Acknowledgments
This image is the copyrighted work of the attributed author or publisher, and ZFIN has permission only to display this image to its users. Additional permissions should be obtained from the applicable author or publisher of the image. Full text @ Development