IMAGE

Fig. 1.

ID
ZDB-IMAGE-240129-210
Source
Figures for Nguyen et al., 2023
Image
Figure Caption

Fig. 1.

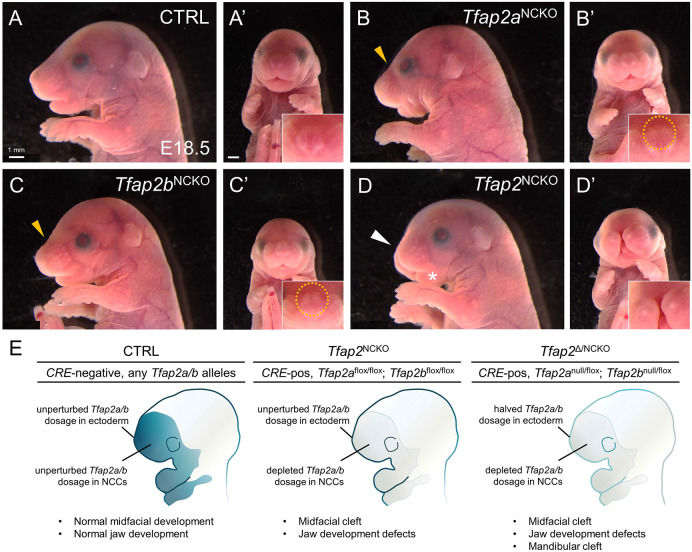
TFAP2A and TFAP2B cooperatively function in CNCCs during midfacial development. (A-D′) Lateral (A-D) or frontal (A′-D′) views of prenatal mice on embryonic day 18.5 (E18.5). Genotypes are as follows: CTRL (CRE-negative, any Tfap2a/b allelic combination; CRE-positive; Tfap2a+/flox; Tfap2b+/flox), Tfap2aNCKO (CRE-positive; Tfap2aflox/flox; Tfap2b+/flox), Tfap2bNCKO (CRE-positive; Tfap2a+/flox; Tfap2bflox/flox) and Tfap2NCKO (CRE-positive; Tfap2aflox/flox; Tfap2bflox/flox). n=5 per genotype. Gold arrowheads in B and C indicate snout indentations. Insets in A′-D′ include higher magnification images of the snout, with misplaced vibrissae outlined. White arrowhead in D indicates the shortened snout; the asterisk indicates mandible hypoplasia. (E) Schematic summarizing regions of Tfap2a and Tfap2b gene deletion in various craniofacial tissues and the corresponding phenotypes (middle, this study; right, Van Otterloo et al., 2018). Regions of deletion are indicated by reduced color intensity.

Acknowledgments
This image is the copyrighted work of the attributed author or publisher, and ZFIN has permission only to display this image to its users. Additional permissions should be obtained from the applicable author or publisher of the image. Full text @ Development