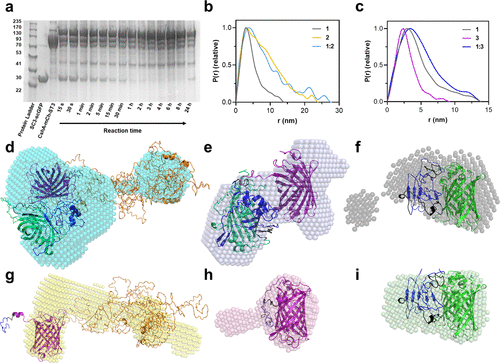
Fig. 2 Characterization of reaction between protein constructs containing SpyCatcher and SpyTag. (a) SDS-PAGE monitoring of the reaction between 1 (10 μM [SC3-scGFP][S], ca. 42.5 kDa) and 2 (10 μM CshA-mCh-ST3, ca. 112 kDa) to yield 1:2 (CshA-mCh-ST3-[SC3-scGFP][S], ca. 155 kDa). (b) Pair-distance distribution function P(r) calculated using ScÅtter from synchrotron radiation small-angle X-ray scattering (SR-SAXS) data of 1 (shown in gray, χ2 = 1.396), 2 (shown in yellow, χ2 = 1.255), and the reaction product between both 1:2 (shown in light blue, χ2 = 1.292). (c) Pair-distance distribution function P(r) calculated using ScÅtter from synchrotron radiation small-angle X-ray scattering (SR-SAXS) data of 1, 3 (mCh-ST3, shown in purple, χ2 = 1.110), and the reaction product between both 1:3 (mCh-ST3-[SC3-scGFP][S], shown in navy blue, χ2 = 1.245). (d–h) Overlay of protein crystal structures and ab initio bead models computed from the SR-SXS data of (d) reaction product of CshA-mCh-ST3 and [SC3-scGFP][S] (1:2, bead model shown in cyan), (e) reaction product of mCh-ST3 and [SC3-scGFP][S] (1:3, bead model shown in navy blue), (f) [SC3-scGFP][S] (1, bead model shown in gray), (g) CshA-mCh-ST3 (2, bead model shown in orange), (h) mCh-ST3 (3, bead model shown in purple), and (i) SC3-scGFP (bead model shown in green). Proteins were modeled with I-TASSER, (32−34) and the models were selected depending on the known structures of SC3–ST3 (shown in navy blue), sfGFP (shown in green), and mCherry (shown in yellow). I-Tasser model C-scores: (d) −3.45, (e) −2.62, (f–i) −2.62, (g) −4.05, and (h) −0.62.
Image
Figure Caption
Acknowledgments
This image is the copyrighted work of the attributed author or publisher, and
ZFIN has permission only to display this image to its users.
Additional permissions should be obtained from the applicable author or publisher of the image.
Full text @ J. Am. Chem. Soc.

