IMAGE

FIGURE 3

ID
ZDB-IMAGE-240124-41
Source
Figures for Ramli et al., 2024
Image
Figure Caption

FIGURE 3

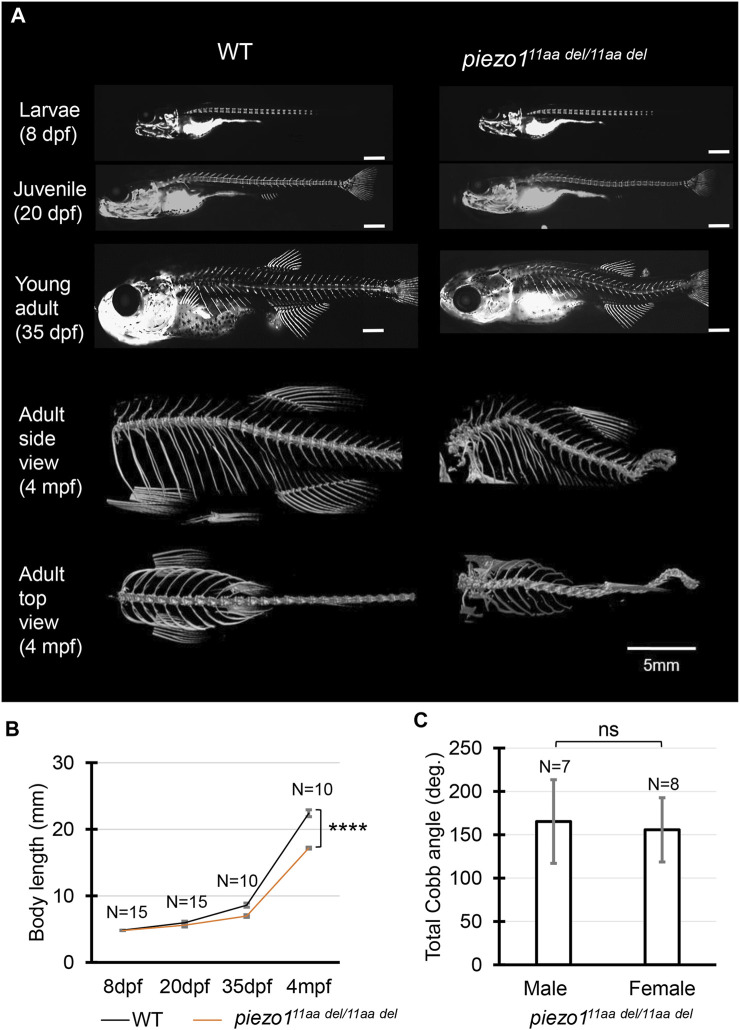
Phenotype of piezo1 in-frame mutant (piezo111aa del/11aa del). (A) Time course observation of mineralized bone using alizarin red S staining between wildtype and piezo111aa del/11aa del mutant from larvae (8 dpf) to young adult (35 dpf) (Used scale 500 μm) and 3D rendering of micro-CT images of wildtype and piezo111aa del/11aa del mutant at 4 months. (B) Graph depicting body length. (C) Average of total Cobb angle. Cobb angles were measured according to previous study (Bearce et al., 2022). Values are presented as mean ± SD and analyzed using Student’s t-test. ****p < 0.0001. ns means non-significant.

Figure Data
Acknowledgments
This image is the copyrighted work of the attributed author or publisher, and ZFIN has permission only to display this image to its users. Additional permissions should be obtained from the applicable author or publisher of the image. Full text @ Front Genet