IMAGE

Fig 7

ID
ZDB-IMAGE-240122-8
Source
Figures for Schumacher et al., 2024
Image
Figure Caption

Fig 7 
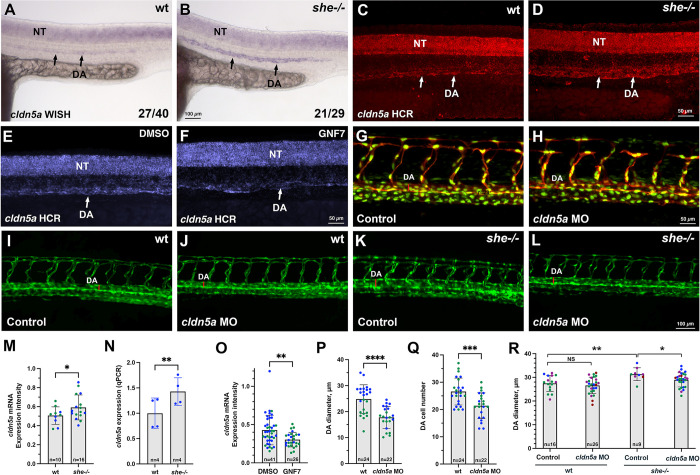
She regulates vascular lumen size by inhibiting cldn5a expression.

(A-D) Chromogenic whole mount in situ hybridization (WISH) (A,B) and fluorescent in situ hybridization analysis using hybridization chain reaction (HCR) (C,D) analysis for cldn5a expression in she mutants and sibling wild-type (she+/+) embryos at 24 hpf. Note increased cldn5a expression in the dorsal aorta (DA) in she mutants while neural tube (NT) expression is unaffected. Quantification of cldn5a expression in the DA is shown in (M). Embryos were obtained by incross of heterozygous she parents and genotyped after WISH or HCR. (E,F) HCR analysis for cldn5a expression in control 0.01% DMSO or 1 μM GNF7 treated kdrl:GFP embryos. Trunk region is shown, anterior is to the left. Note the reduction in cldn5a expression in the DA while neural tube expression is unaffected. Quantification is shown in (O). (G,H) 2 ng cldn5a MO injection reduces DA size (red line across the DA) and DA cell number in kdrl:mCherry; fli1:NLS-GFP embryos at 28 hpf. Quantification is shown in (P,Q). (I-L) 1 ng dose cldn5a MO injection reduces enlarged DA in she mutants. Embryos were obtained by an incross of she+/-; kdrl:GFP parents and imaged for GFP expression at 2 dpf. Mid-trunk region is shown, anterior is to the left. Quantification is shown in (R). Note the increase in DA width (red line) in she mutants (K), which is reduced upon cldn5a MO injection (L). (M) Quantification of cldn5a expression in the DA of she mutants and wild-type siblings after HCR fluorescent in situ hybridization at 24 hpf. To reduce the staining variability between different embryos, expression values in the DA were normalized to the neural tube expression in each embryo. Expression analysis was performed blindly without knowledge of embryo genotypes. Datapoints have been combined from two independent experiments, shown in different colors. Mean±SD shown. *p<0.05, Student’s t-test. (N) qPCR analysis of cldn5a expression in FACS-sorted vascular endothelial cells obtained from she mutant and wild-type embryos at 24 hpf. Expression was normalized to the house-keeping EF1a gene. Embryos were obtained by incross of she-/-; fli1:she-2A-mCherry+/- or she+/+ (wild-type); fli1:she-2A-mCherry+/- parents in kdrl:GFP background and sorted for the absence of mCherry. Mean±SD shown. **p<0.01, Student’s t-test. (O) Quantification of cldn5a expression in embryos treated with 0.01% DMSO or 1 μM GNF7 at 24 hpf. Relative expression in the DA was calculated by dividing the intensity in the DA over the expression intensity in the neural tube. Datapoints have been combined from two independent experiments, shown in different colors. Error bars show mean±SD. **p<0.01, Student’s t-test. (P,Q) Quantification of DA diameter (P) and DA cell number (Q) in embryos injected with 2 ng of cldn5a MO. Datapoints were combined from two independent experiments, shown in different colors. Mean±SD shown. ***p<0.001, ****p<0.0001, Student’s t-test. (R) Quantification of DA diameter at 2 dpf in wild-type and she mutant embryos injected with 1 ng cldn5a MO. Mean±SD shown. *p<0.05, ** p<0.01, NS–not significant, one-way ANOVA analysis, followed by multiple comparisons Fisher’s LSD test.

Acknowledgments
This image is the copyrighted work of the attributed author or publisher, and ZFIN has permission only to display this image to its users. Additional permissions should be obtained from the applicable author or publisher of the image. Full text @ PLoS Genet.