IMAGE

FIGURE 3

ID
ZDB-IMAGE-240118-17
Source
Figures for Chen et al., 2024
Image
Figure Caption

FIGURE 3

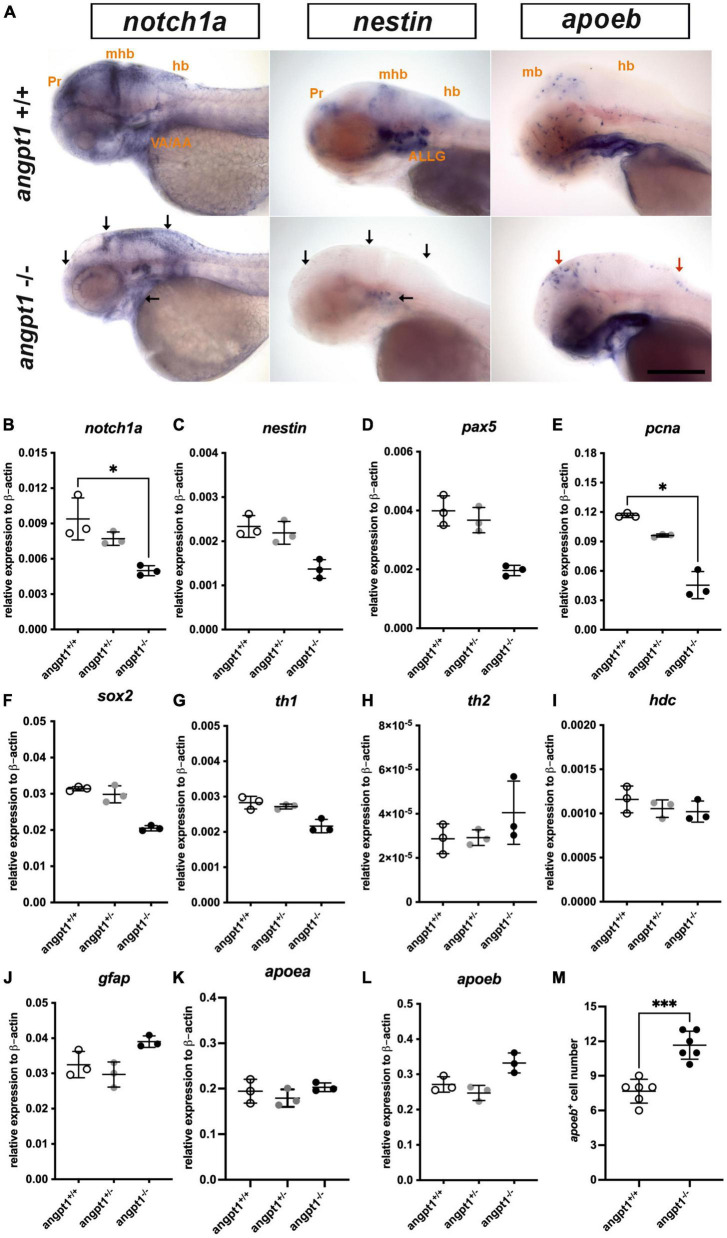
mRNA expression levels of neurogenesis markers in 3-dpf angpt1–/– larvae. (A) Expression patterns of notch1a, nestin (nes), and apoeb in 3-pf angpt1+/+ and angpt1–/– larvae done by WISH. Quantification of mRNA levels done by qPCR using 3-dpf angpt1+/+, angpt1± and angpt1–/– larvae shown in (B)notch1a; (C)nestin; (D)pax5; (E)pcna; (F)sox2; (G)th1; (H)th2; (I)hdc; (J)gfap; (K)apoea; (L)apoeb; (M) Quantification of apoeb-positive cell numbers in the midbrain, N = 6, P = 0.0001. Samples were genotyped with HRM analysis. N = 6 per group for WISH. N = 3 For qPCR, replications in each genotyped group (10-pooled embryos in one replication). ALLG, anterior lateral line ganglion; hb, hindbrain; mhb, midbrain-hindbrain boundary; ov, otic vesicle; Pr, pretectum. Black arrows indicate regions showing decreased expression in angpt1–/– compared with angpt1+/+ larvae. Red arrows indicate regions showing increased angpt1–/– expression compared with angpt1+/+ larvae. Statistical analysis of qPCR results is shown in mean ± SD by the Kruskal–Wallis test with Dunn’s multiple comparisons test. Statistical analysis of apoeb+ cell numbers is shown in mean ± SD by unpaired Student t-test. *p < 0.05, ***p < 0.001. Scale bar is 200 μm.

Acknowledgments
This image is the copyrighted work of the attributed author or publisher, and ZFIN has permission only to display this image to its users. Additional permissions should be obtained from the applicable author or publisher of the image. Full text @ Front. Cell. Neurosci.