
|
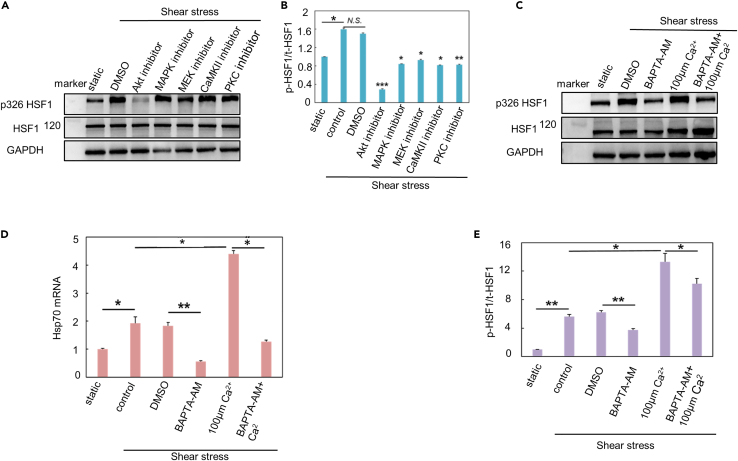
Fig. 5 Ca2+ and Akt signals were involved in HSF1 activation by shear stress (A) Western blot results of phosphorylated HSF1 at serine 326 and total HSF1 in MDCK cells under shear stress in the presence of inhibitors or DMSO. (B) Statistical analysis of the results in (A) (n = 3). Data are expressed as mean ± SEM, ∗p < 0.05, ∗∗p < 0.01,∗∗∗p < 0.001 (C) Western blot results of phosphorylated HSF1 at serine 326 and total HSF1 in MDCK cells under shear stress in the presence of Ca2+ antagonist or Ca2+. (D) Statistical analysis of the results in (B) (n = 3). Data are expressed as mean ± SEM, ∗p < 0.05, ∗∗p < 0.01. (E) The expression level of hsp70 mRNA in MDCK cells under shear stress in the presence of Ca2+ antagonist or Ca2+ (n = 3). Data are expressed as mean ± SEM, ∗p < 0.05, ∗∗p < 0.01.