
Image
|
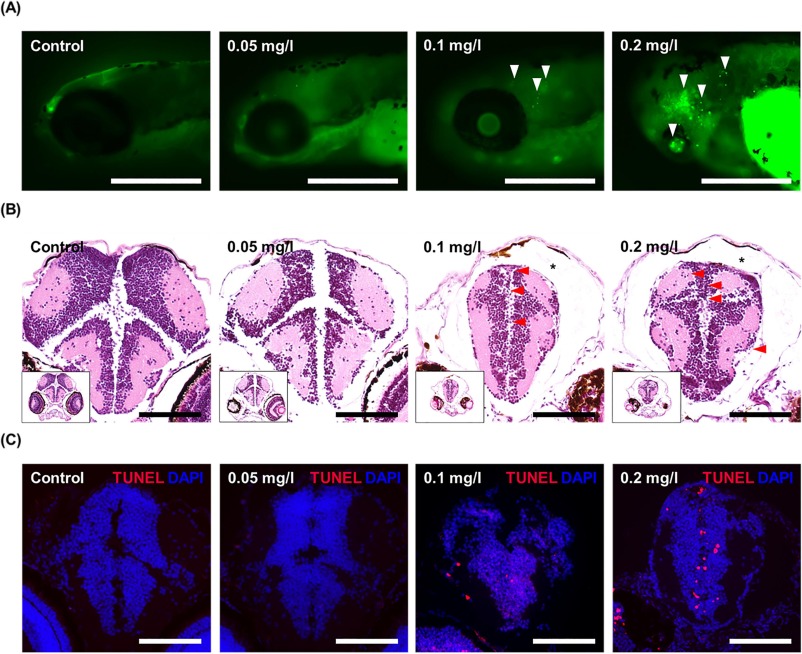
Figure Caption
Fig. 3 Apoptosis in zebrafish embryo induced by FBZ exposure until 96 hpf. (A) The acridine orange positive cells detected in the zebrafish brain region (white arrowhead). Scale bar = 400 μm. (B) Enlarged space between the skull and brain (asterisk) and pyknotic nuclei (red arrowhead) in histopathological analysis of zebrafish exposed to FBZ (0.1, and 0.2 mg/l). Scale bar = 100 μm. (C) TUNEL analysis of zebrafish brain exposed to control, 0.05, 0.1, and 0.2 mg/l of FBZ. Scale bar = 100 μm.
Acknowledgments
This image is the copyrighted work of the attributed author or publisher, and
ZFIN has permission only to display this image to its users.
Additional permissions should be obtained from the applicable author or publisher of the image.
Full text @ Sci. Total Environ.