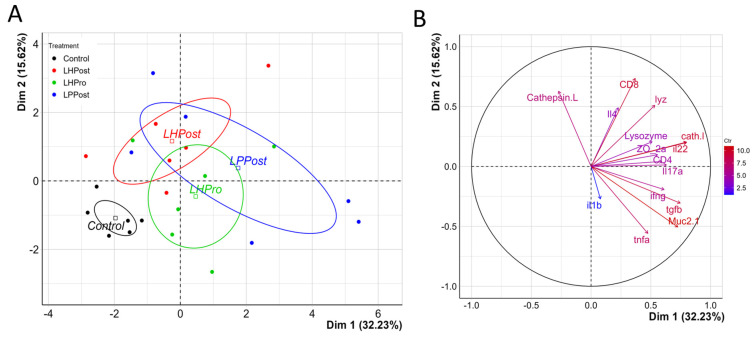
Positive differentiation of immune response markers as shown by principal component analysis. (A) PCA plot of individuals and their distribution that was significantly affected by the immune response variables as indicated in (B). Confidence ellipses drawn around the levels of the categorical variables for treatment status with a confidence level of 0.95; variables plot showing the highest (red) to lowest (blue) contribution of variables to the PCA plot (A). Cathepsin L and Lysozyme indicate markers measured by ELISA; immune gene expression markers are indicated in lower case; CD8 and CD4 indicated specific T-cell markers for adaptive immune cell phenotypes (CD8α+ and CD4+ cells, respectively); tight junction and mucus biomarkers were indicated by ZO- 2a and Muc2.1, respectively.
Acknowledgments
This image is the copyrighted work of the attributed author or publisher, and
ZFIN has permission only to display this image to its users.
Additional permissions should be obtained from the applicable author or publisher of the image.
Full text @ Microorganisms
Your Input Welcome
Thank you for submitting comments. Your input has been emailed to ZFIN curators who may contact you if
additional information is required.
Oops. Something went wrong. Please try again later.