
Image
|
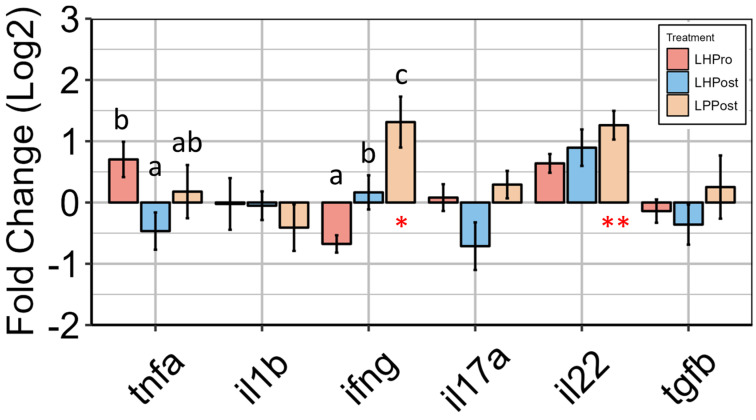
Figure Caption
Figure 5
Gene expression analysis reveals the modulation of innate immune effector cytokines by postbiotic groups in the posterior intestine of zebrafish. Relative expression level (fold change (Log2)) to the control group of innate immune markers is shown. Data are presented as mean ± SEM. Symbols in red denote significance in gene expression compared to the control group (*
Acknowledgments
This image is the copyrighted work of the attributed author or publisher, and
ZFIN has permission only to display this image to its users.
Additional permissions should be obtained from the applicable author or publisher of the image.
Full text @ Microorganisms