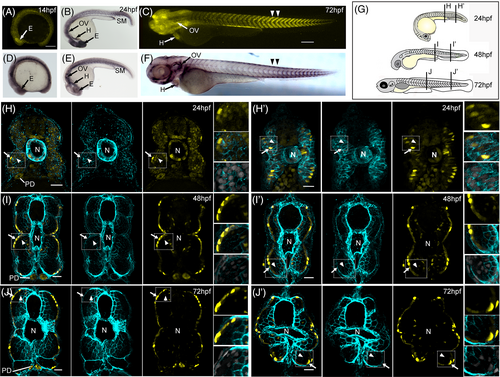
Fig. 5 Tg(tgfbr3:nls-mCherry) recapitulates tgfbr3 expression in skeletal muscle linage. (A-F) Lateral views of whole mounted embryos immunostained for Tgfbr3 (panels D-F) or mCherry protein (panel B); in panels A and C, the reporter mCherry fluorescence is shown. Panels D to F show Tgfbr3 protein expression in heart (H), otic vesicle (OV), eye (E), and skeletal muscle (SM). At 72 hpf, mCherry fluorescence and Tgfbr3 are higher in the posterior trunk somites (double arrowhead in C and F, respectively). Panels A to C show that mCherry expression matches with the co-receptor immunodetection at the indicated structures and time points. (H-J') The expression of Tgfbr3 protein (cyan) and mCherry (yellow) detected by fluorescent immunohistochemistry on transversal sections from the embryo regions and hpf indicated in the cartoon shown in panel G. White arrowheads indicate deep muscle fiber cells and white arrows show superficial muscle cells with mCherry and protein expression in the somitic skeletal muscle. The insets also show the expression of Tgfbr3 and mCherry protein in skeletal muscle cells, Hoechst staining all the nuclei (light gray). Notochord (N) and pronephric duct (PD) position and Tgfbr3 expression are also indicated. Scale bars 50 μm.
Image
Figure Caption
Acknowledgments
This image is the copyrighted work of the attributed author or publisher, and
ZFIN has permission only to display this image to its users.
Additional permissions should be obtained from the applicable author or publisher of the image.
Full text @ Dev. Dyn.

