
|
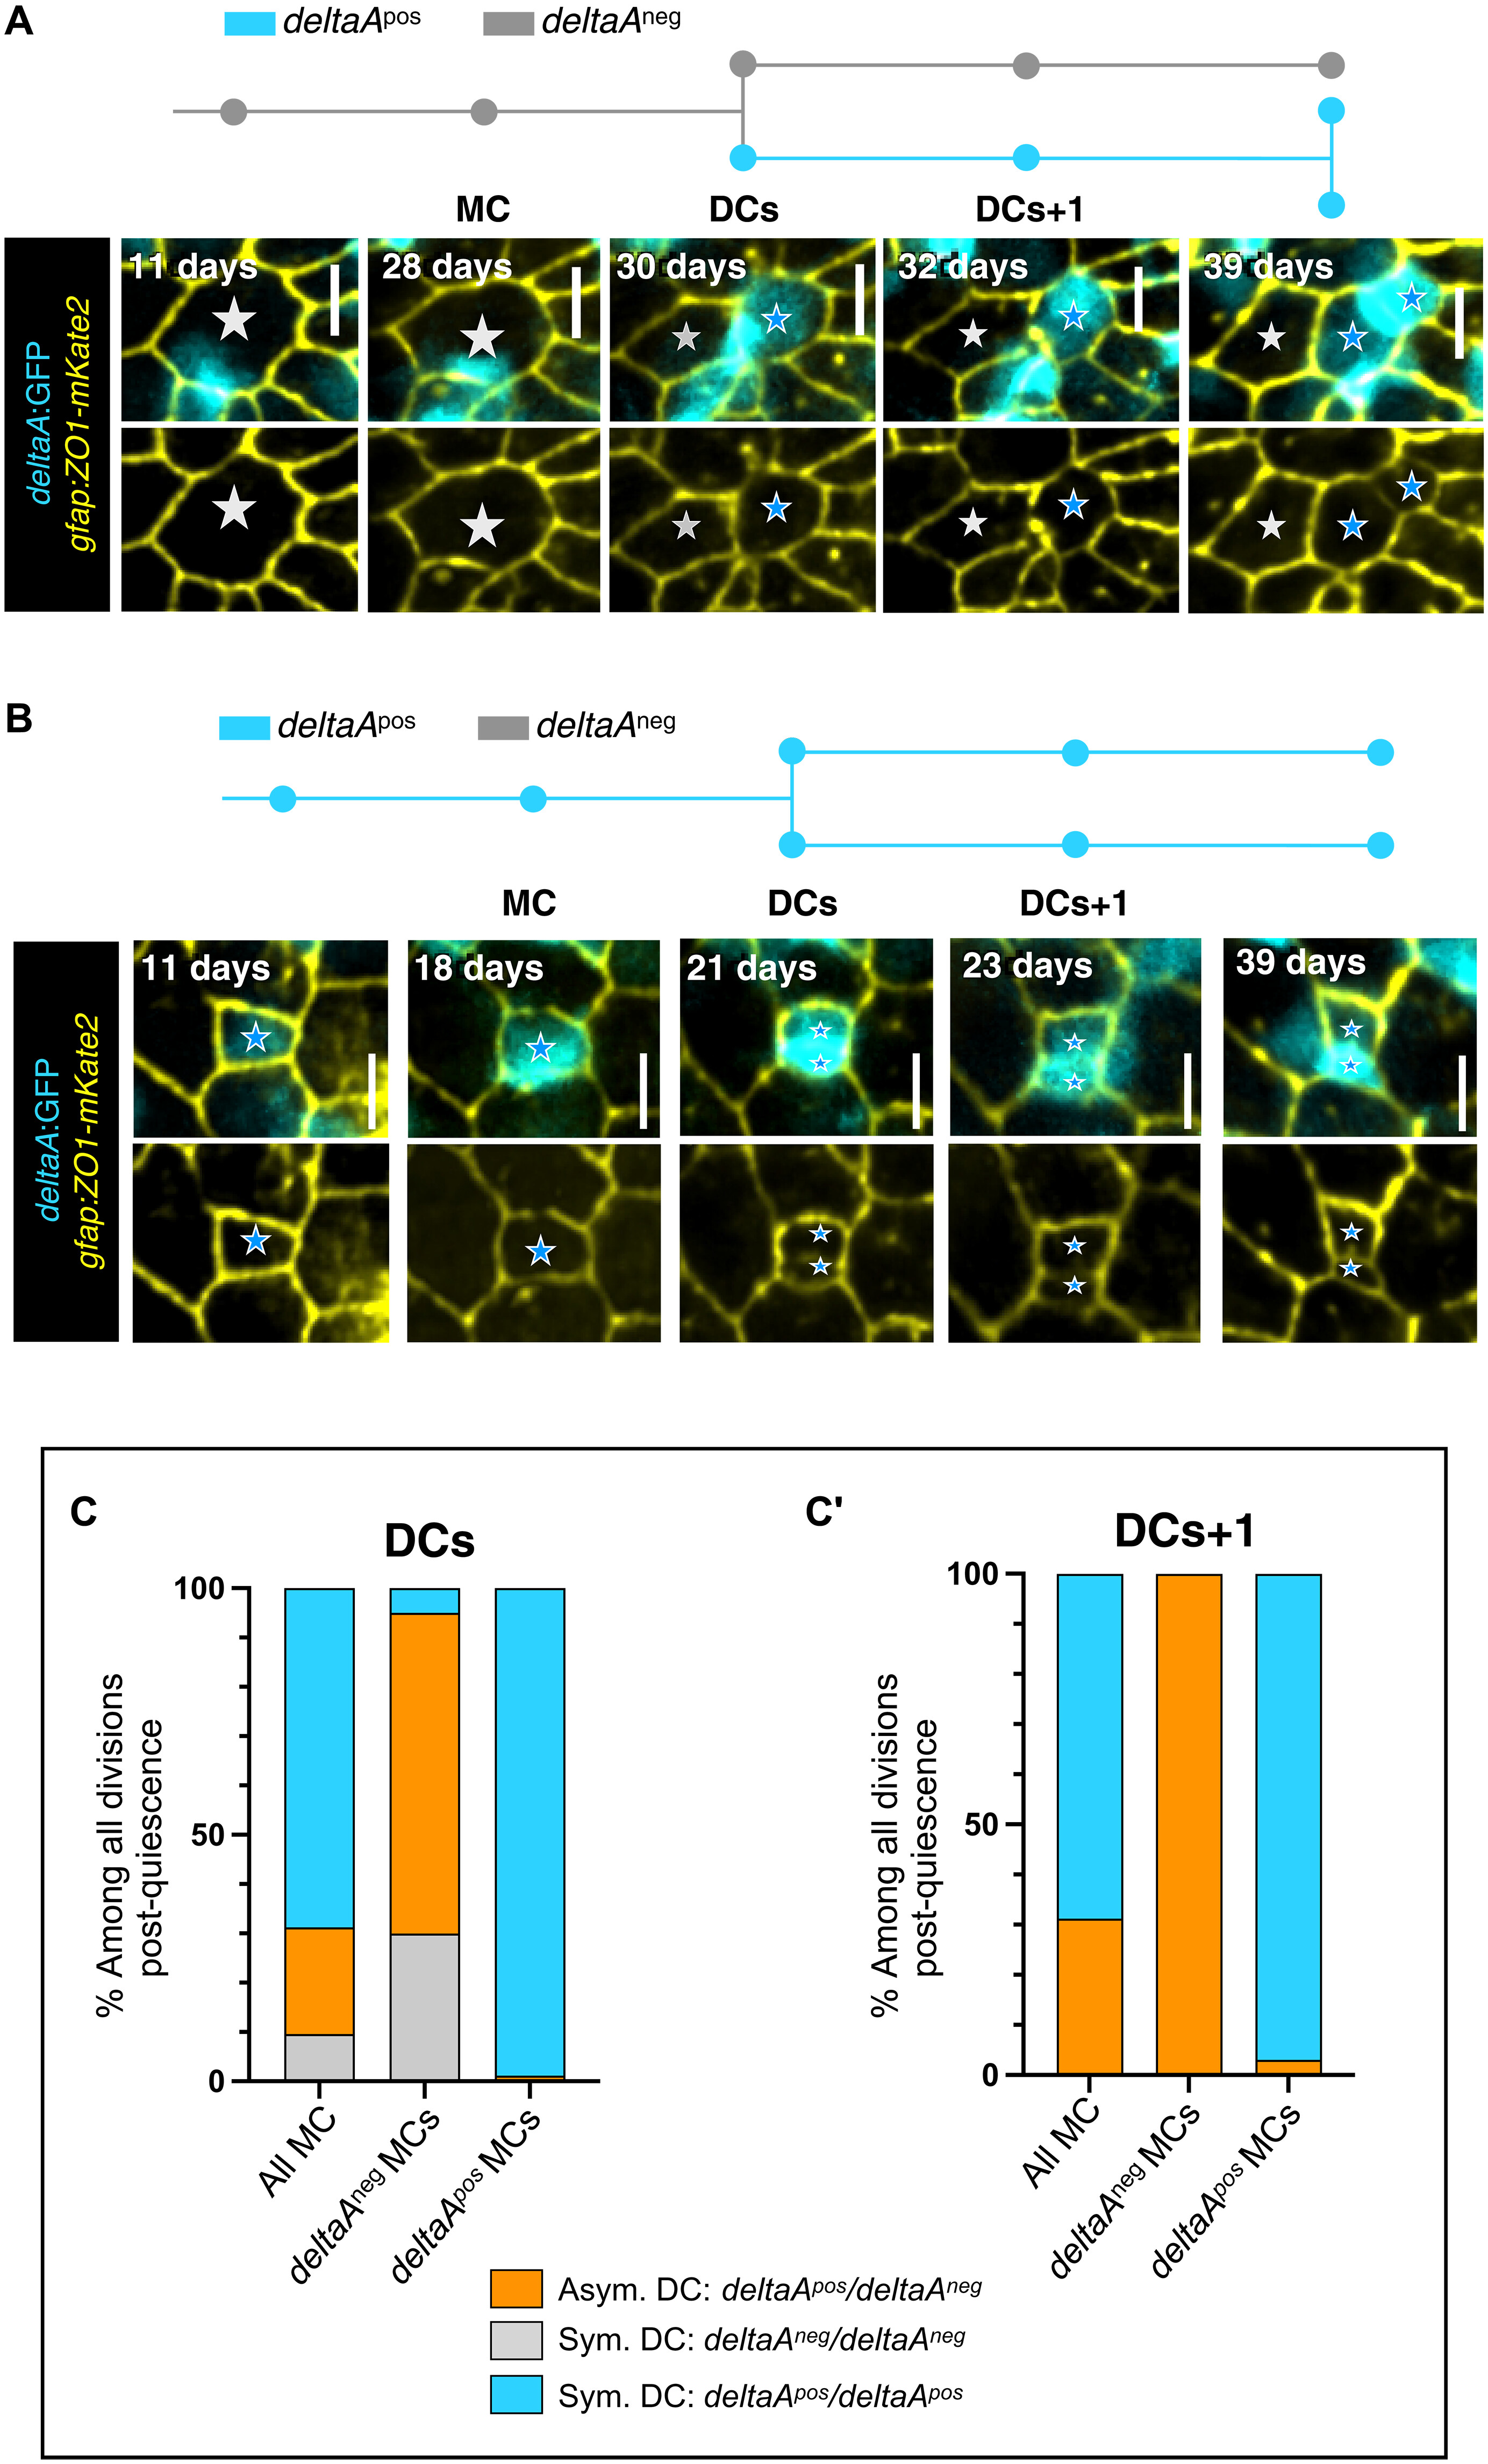
Fig. 4 The deltaA expression status of NSCs predicts different division modes. (A and B) Examples of asymmetric (A) and symmetric (B) divisions based on deltaA expression. In each case, the track (deltaApos NSCs: blue; deltaAneg NSCs: gray) corresponds to the representative snapshots displayed underneath, showing gfap:ZO1-mKate2 (yellow) and deltaA:GFP (cyan) (top) or gfap:ZO1-mKate2 only (bottom). Stars to MC and its DCs (gray stars: deltaA OFF, blue stars: deltaA ON). (C and C′) Percentages of each division mode observed for DCs (C) and DCs+1 (C′) (asymmetric deltaAneg/deltaApos: orange; symmetric deltaAneg/deltaAneg: gray; symmetric deltaApos/deltaApos: blue) depending on the deltaApos or deltaAneg status of the MC.