
|
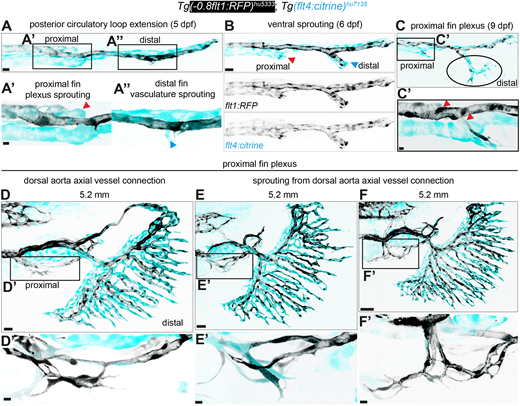
Fig. 5 Proximal fin plexus and caudal fin arteries have distinct origins. Maximum intensity projections of confocal z-stacks of Tg(-0.8flt1:RFP)hu5333; Tg(flt4:citrine)hu7135 double-transgenic fish labelling all arterial ECs (black) and venous ECs (cyan) in lateral views; anterior towards the left. (A) Posterior circulatory loop (PCL) at 5 dpf. Scale bar: 10 μm. (A′) Proximal fin plexus. (A″) Distal fin vasculature. Scale bars: 4 μm. (B,C) Proximal fin plexus (red arrowhead); distal fin vasculature (blue arrowhead). Scale bar: 15 μm. (C′) Proximal fin plexus (red arrowheads) connection with the dorsal aorta (DA). Scale bar: 5 μm. (D-F) Formation of proximal fin plexus. Scale bars: 20 μm for D; 30 μm for E,F. (D′-F′) Formation of the proximal plexus from the DA. Scale bars: 7 μm for D′,F′; 5 μm for E′.