IMAGE

FIGURE 3

ID
ZDB-IMAGE-231201-22
Source
Figures for Tan et al., 2023
Image
Figure Caption

FIGURE 3

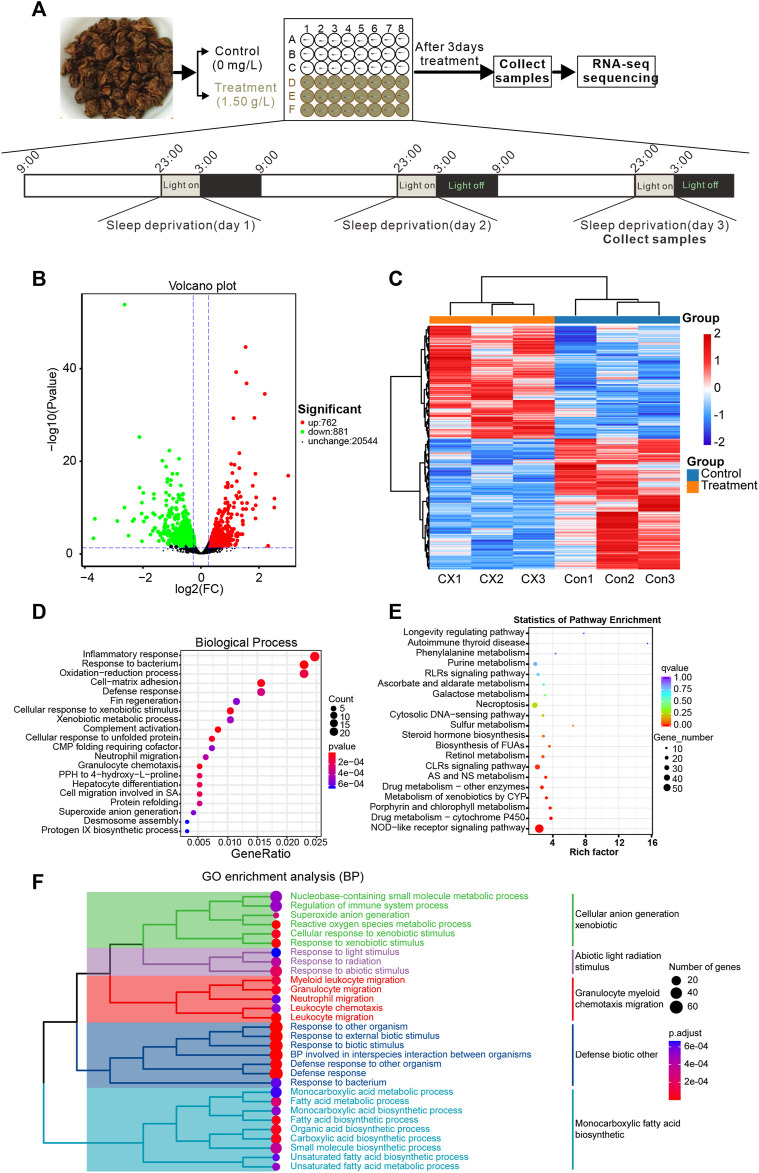
Transcriptome sequencing reveals changes in gene expression in zebrafish larvae exposed to Aquilaria sinensis leaf tea with sleep disturbance. (A) The schematic diagram shows the treatment and sample collection time of A. sinensis leaf tea-treated larvae under sleep disturbance conditions. The transcriptome of untreated larvae (0.00 g/L; Control) and larvae treated with 1.50 g/L tea (Treatment) and collected at 3:00 (ZT 18) on the third day of treatment. (B) The Volcano map displays the transcriptome sequencing results. (C) Heatmap of 1643 differentially expressed genes (p-value ≤0.05, log2FC ≥ 1.2). (D) GO enrichment analysis of the DEGs. (E) KEGG enrichment analysis showed that many genes were enriched in the NOD-like receptor. (F) The clustered heatmap of GO enrichment analysis, such as the regulation of the immune system process, myeloid leukocyte migration, granulocyte migration, neutrophil migration, leukocyte chemotaxis, and leukocyte migration.

Acknowledgments
This image is the copyrighted work of the attributed author or publisher, and ZFIN has permission only to display this image to its users. Additional permissions should be obtained from the applicable author or publisher of the image. Full text @ Front Pharmacol