
|
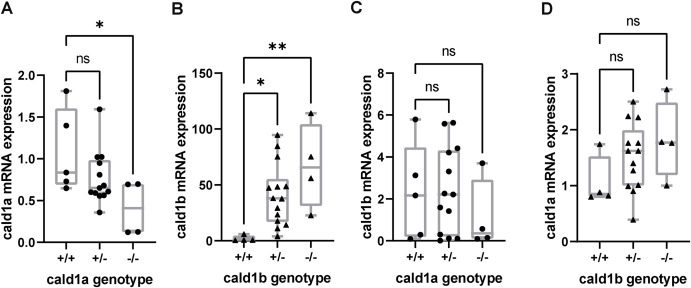
Fig. 3 cald1a and cald1b mutant mRNAs have abnormal expression levels. (A) Relative cald1a mRNA expressions in different genotypes of cald1a (left) (nWT = 5, n(±) = 15, and n(−/−) = 4). (B) Relative cald1b mRNA expressions in different genotypes of cald1b (right) (nWT = 4, n(±) = 14, and n(−/−) = 4) in zebrafish larvae (C) Relative cald1b mRNA expressions in different genotypes of cald1a (right) (nWT = 5, n(±) = 13, and n(−/−) = 4). (D) Relative cald1a mRNA expressions in different genotypes of cald1b (left) (nWT = 4, n(±) = 14, and n(−/−) = 4) in zebrafish larva. ns = not significant, ∗p < 0.05, ∗∗p < 0.01, and ∗∗∗p < 0.001 as determined by ANOVA.