
|
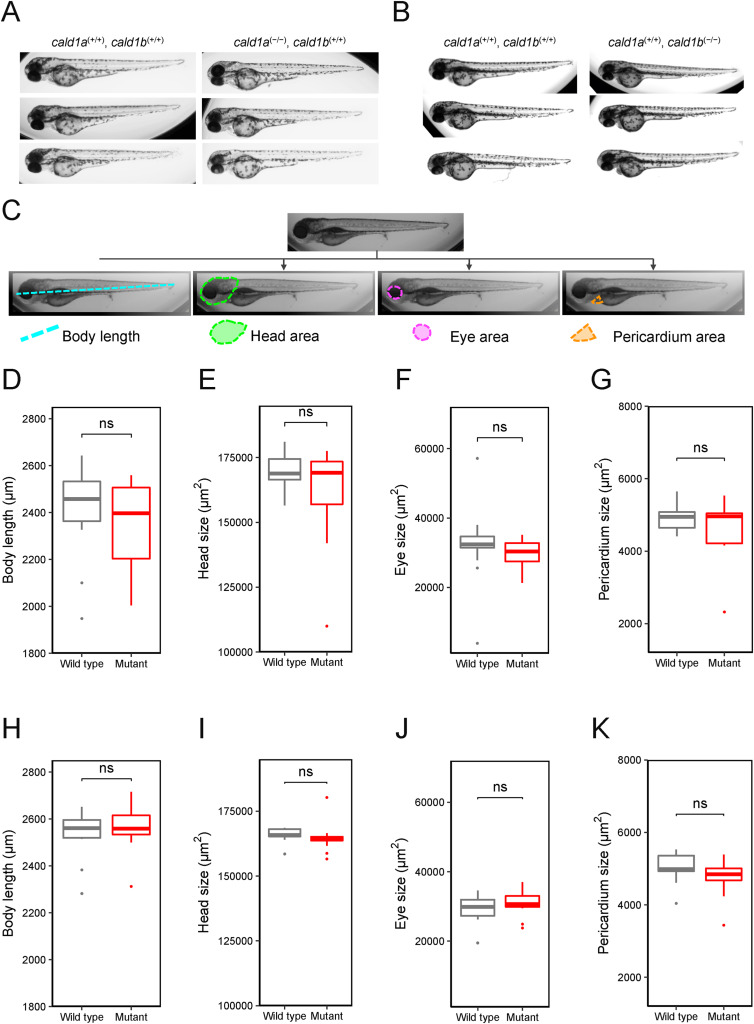
Fig. 2 Analyses of the anatomy of cald1a and cald1b single-mutant zebrafish. (A) Representative brightfield images of wild-type zebrafish larvae cald1a (+/+), cald1b (+/+) (left) and single-mutant zebrafish larvae cald1a (−/−), cald1b (+/+) (right) 4 dpf. (B) Representative brightfield images of wild-type zebrafish larvae cald1a (+/+), cald1b (+/+) (left) and single-mutant zebrafish larvae cald1a (+/+), cald1b (−/−) (right) 4 dpf. 19) (C) Schematic illustration of the measurements taken from the zebrafish larvae. Body length, head area, eye area and pericardium area are highlighted over the duplicates of the original image with teal, green, purple, and orange, respectively. (D–G) Morphological measurements and analyses display no statistically significant changes in body length, head size, eye size, and in pericardial area when compared wild-type cald1a (+/+), cald1b (+/+) (n = 22) larvae to single-mutant larvae cald1a (−/−), cald1b (+/+) (n = 12). All measurements were done by two independent investigators. (H–K) Morphological measurements and analyses display no statistically significant changes in body length, head size, eye size, and in pericardial area when compared wild-type cald1a (+/+), cald1b (+/+) larvae (n = 13) to single-mutant larvae cald1a (+/+), cald1b (−/−)(n = 19). All measurements were done by two independent investigators. (For interpretation of the references to colour in this figure legend, the reader is referred to the Web version of this article.)