
|
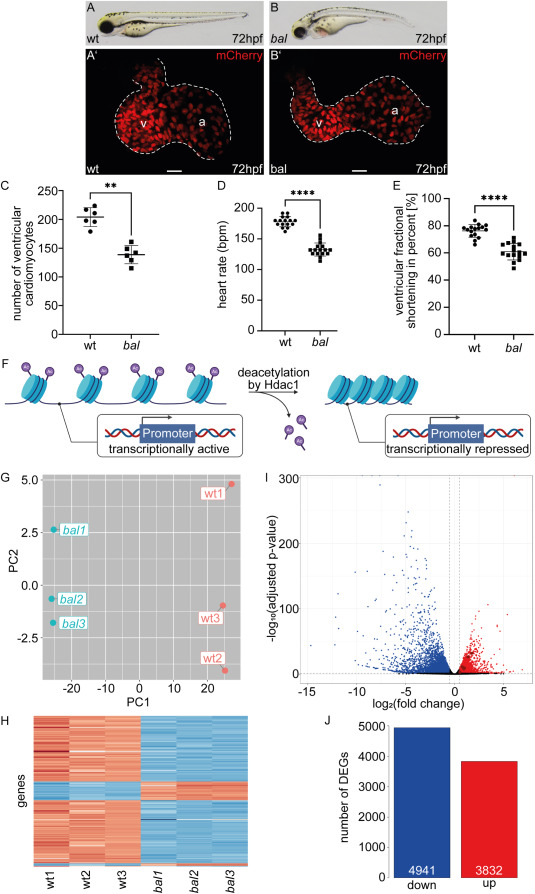
Fig. 1 The baldrian mutation results in a reduced number of ventricular cardiomyocytes and a large number of DEGs (A–B) Lateral view of representative 72 h post fertilization (hpf) wildtype sibling (wt) (A) and baldrian (bal) mutant embryos (B). (A′-B′) Embryonic hearts of bal x Tg[myl7:mCherry-NLS] expressing mCherry in cardiomyocyte nuclei. Size of the ventricle appears reduced in bal mutants (B′) compared to wt (A′) (v: ventricle, a: atrium, scale bar 20 μm). (C) Ventricular cardiomyocyte numbers are significantly reduced in bal mutants (wt 204.17 ± 16.39, n = 6, bal 138.83 ± 15.96, n = 6, Mann-Whitney-test, ∗∗p < 0.01). (D) Heart rate in beats per minute (bpm) is reduced in bal (wt 178.13 ± 8.41, n = 16, bal 132.75 ± 10.71, n = 16, Mann-Whitney-test, ∗∗∗∗p < 0.0001). (E) The ventricular fractional shortening is significantly reduced in bal mutants (wt 76.26 ± 4.67%, n = 16, bal 60.98 ± 6.06%, n = 16, Mann-Whitney-test, ∗∗∗∗p < 0.0001) (F) Scheme of transcriptionally active chromatin deacetylation by Hdac1, resulting in compact chromatin with reduced access for the transcription machinery and therefore, transcriptional repression (modified image using BioRender.com [39])(G) Principal component analysis (PCA) plotting the Principal Component 2 (PC2) of the six analyzed RNA-sequencing samples against the PC1. Wt samples are labeled in red and bal samples in blue. Wt and bal cluster in PC1 (−25.31 (bal1), −25.94 (bal2), −25.50 (bal3), 27.08 (wt1), 25.15 (wt2), 24.53 (wt3)), whereas the individual replicates are separated by PC2 (2.64 (bal1), −0.64 (bal2), −1.79 (bal3), 4.81 (wt1), −4.06 (wt2), −0.97 (wt3)). (H) Heatmap of gene expression of the 500 most variable genes showing a clear difference between wt and bal samples. Low read counts are indicated in blue and high read counts in red. (I) Volcano plot of differentially expressed genes (DEGs) in bal compared to wt. Significantly upregulated (red) and downregulated genes (blue) are color-coded according to adjusted p-value<0.05 and |log2(FC)|>0.5. Main regulators of DNA damage response are highlighted in dark red. (J) Barplot of down- (4941) and upregulated (3832) DEGs with the threshold adjusted p-value<0.05 and |log2(FC)|>0.5.