IMAGE

Fig. 6

ID
ZDB-IMAGE-231002-96
Source
Figures for Anderson et al., 2023
Image
Figure Caption

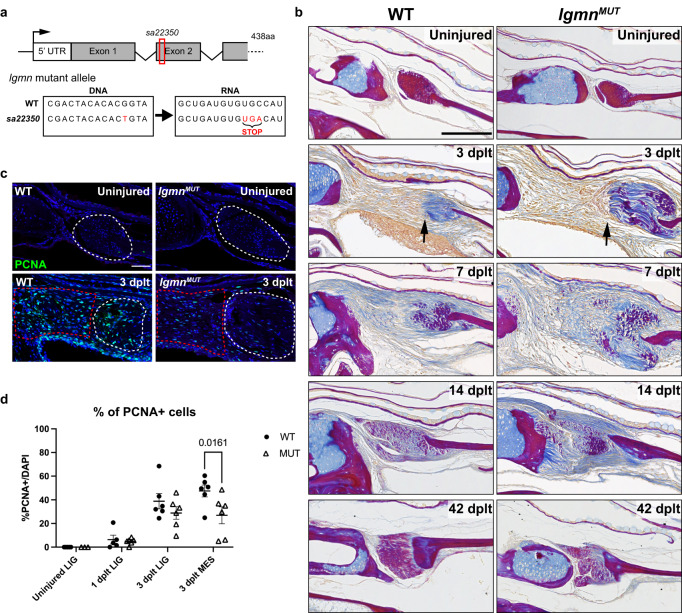
Fig. 6 Dysregulated ECM remodeling and decreased proliferation in lgmn mutant after ligament transection.

a Schematic of lgmn mutant locus showing a point mutation in exon 2 that encodes for an early stop codon. b Acid Fuchsin Orange-G (AFOG) histology staining of ECM remodeling in wild type and lgmn mutant IOM ligament regeneration in uninjured, 3 dplt, 7 dplt, 14 dplt, and 42 dplt. Black arrow denotes interface of injured ligament bundle with invading cells. Collagen is stained blue, protein deposits are stained red/purple, and cellular cytoplasm is stained orange (n = 3-5 per time point). c Representative images of PCNA immunofluorescence in wild type and lgmn mutants in uninjured and 3 dplt IOM ligaments. Region of interest for quantification is outlined in white dashed lines for the ligament and red dashed lines for regenerative mesenchyme domain. d Quantification of percentage of PCNA positive cells normalized with total DAPI-stained nuclei (n = 3-6 per time point); error bar represents SEM, p = 0.0161. Scale bars = 150 μm (b), 50 μm (c).

Acknowledgments
This image is the copyrighted work of the attributed author or publisher, and ZFIN has permission only to display this image to its users. Additional permissions should be obtained from the applicable author or publisher of the image. Full text @ NPJ Regen Med