Image
Figure Caption
Fig. 3
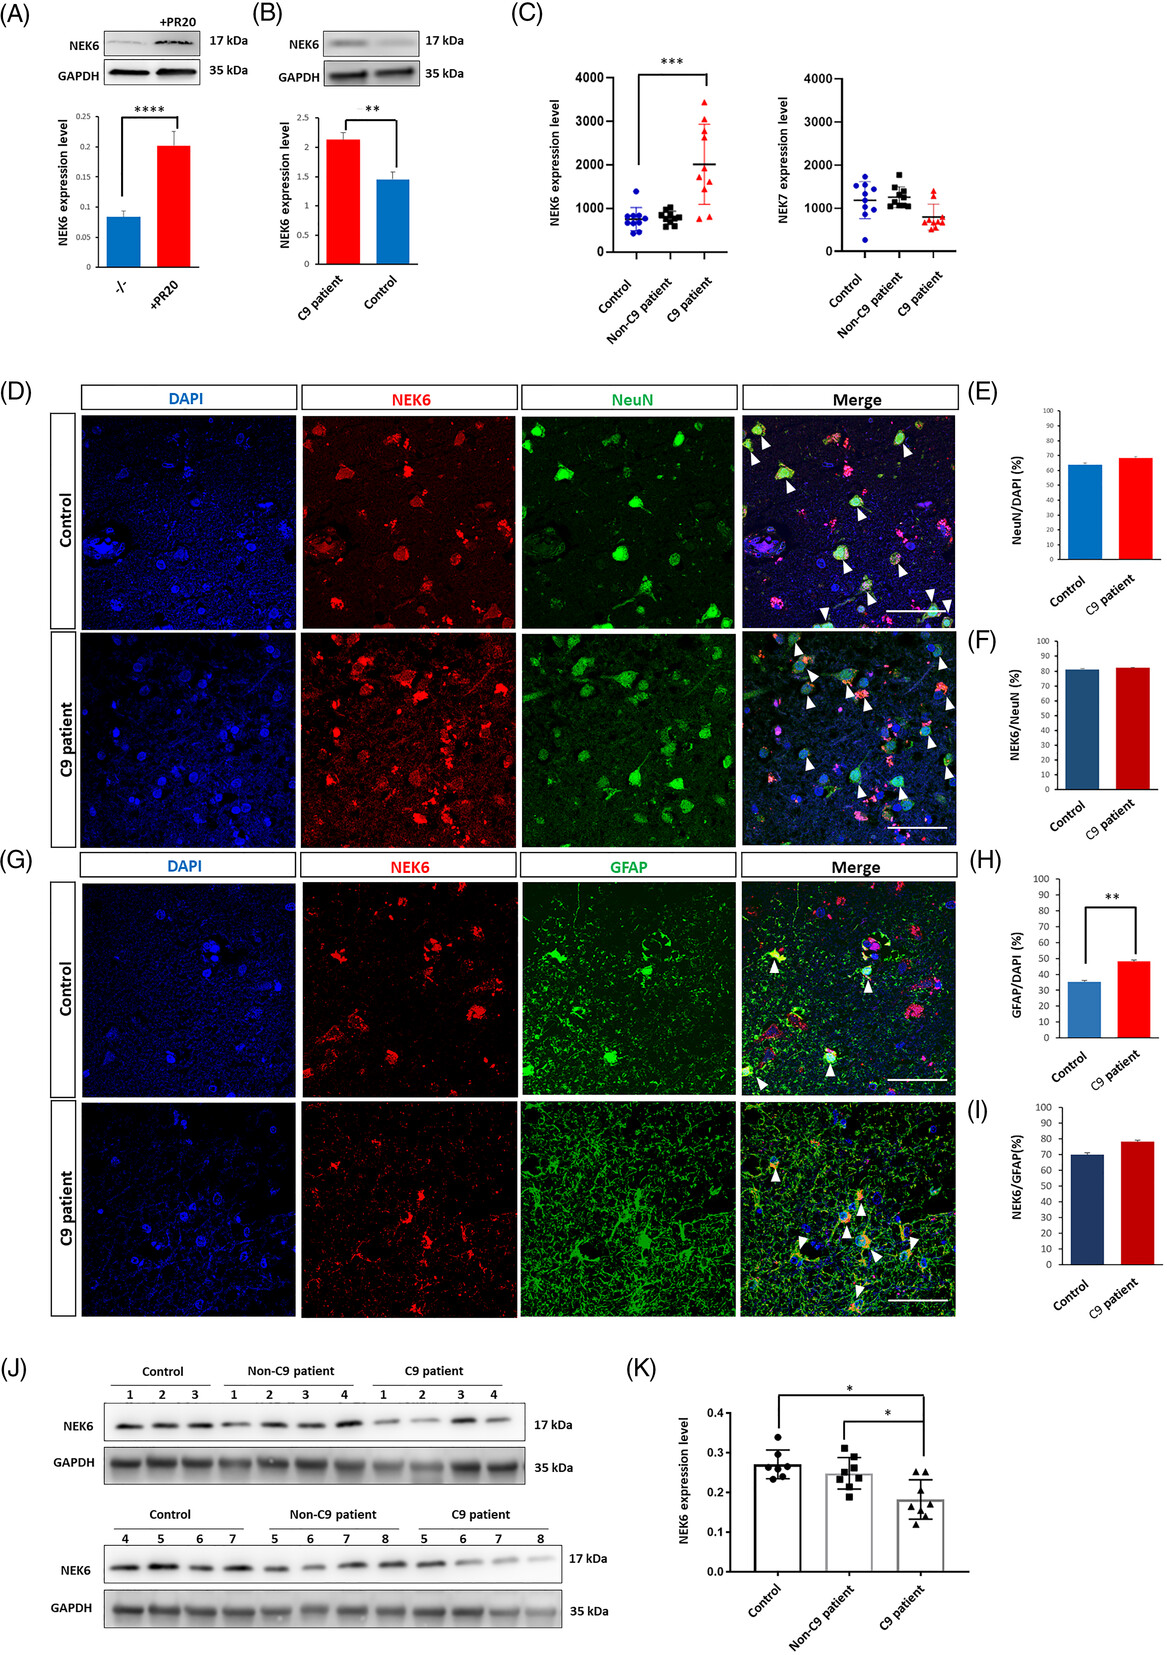
NEK6 expression profile in human iPSC-derived neurons and C9orf72 postmortem brain tissues. (A) Western blot analysis for NEK6 expression in iPSC-derived cortical neurons w/wo 1.5 μM PR20 treatment. (B) Western blot analysis of NEK6 expression in C9orf72 patient-derived cortical neurons and their isogenic controls. (C) qPCR detection of NEK6 and NEK7 transcripts in PBMCs of healthy donors (control, n = 10), sporadic ALS patients without known mutations (Non-C9 patient, n = 10) and ALS patients carrying C9orf72 mutation (C9 patient, n = 10). (D) Immunostaining of NEK6 and NeuN in postmortem motor cortex tissues from C9orf72 patients and non-neurological disorder case controls (white arrows indicate the colocalized NEK6 and NeuN staining). (E) Quantification of neuronal cell percentage in both conditions from (D). (F) Quantification of NEK6 expressing cell percentage in neuronal population from (D). (G) Immunostaining for NEK6 and GFAP in postmortem motor cortex tissues from C9orf72 patients and non-neurological disorder case controls (white arrowheads indicate the colocalized NEK6 and GFAP staining). (H) Quantification of astrocyte percentage in both conditions from (G). (I) Quantification of NEK6 expressing cell percentage in astrocytes population from (G). (J) Western blot analysis of NEK6 expression in motor cortex tissue from ALS or FTD patients carrying C9orf72 mutations (C9 patient, n = 8), non-neurological disorder case controls (Control, n = 7) and ALS or FTD patients that do not carry C9orf72 mutations (Non-C9 patient, n = 8). (K) Quantification of (J). The images shown as a representative example were C9-1 case and Con-6 case. The quantification of the images was based on the C9-1 and C9-7 cases, and the Con-6 and Con-8 cases. For details about the human cases see Table S4. Data were plotted as mean ± SEM. Statistical significance was evaluated with one-way ANOVA and post-hoc Tukey's test; *, **, *** P value of <0.05,<0.01, <0.001, respectively
Acknowledgments
This image is the copyrighted work of the attributed author or publisher, and
ZFIN has permission only to display this image to its users.
Additional permissions should be obtained from the applicable author or publisher of the image.
Full text @ Alzheimers Dement

