Image
Figure Caption
Fig. 2
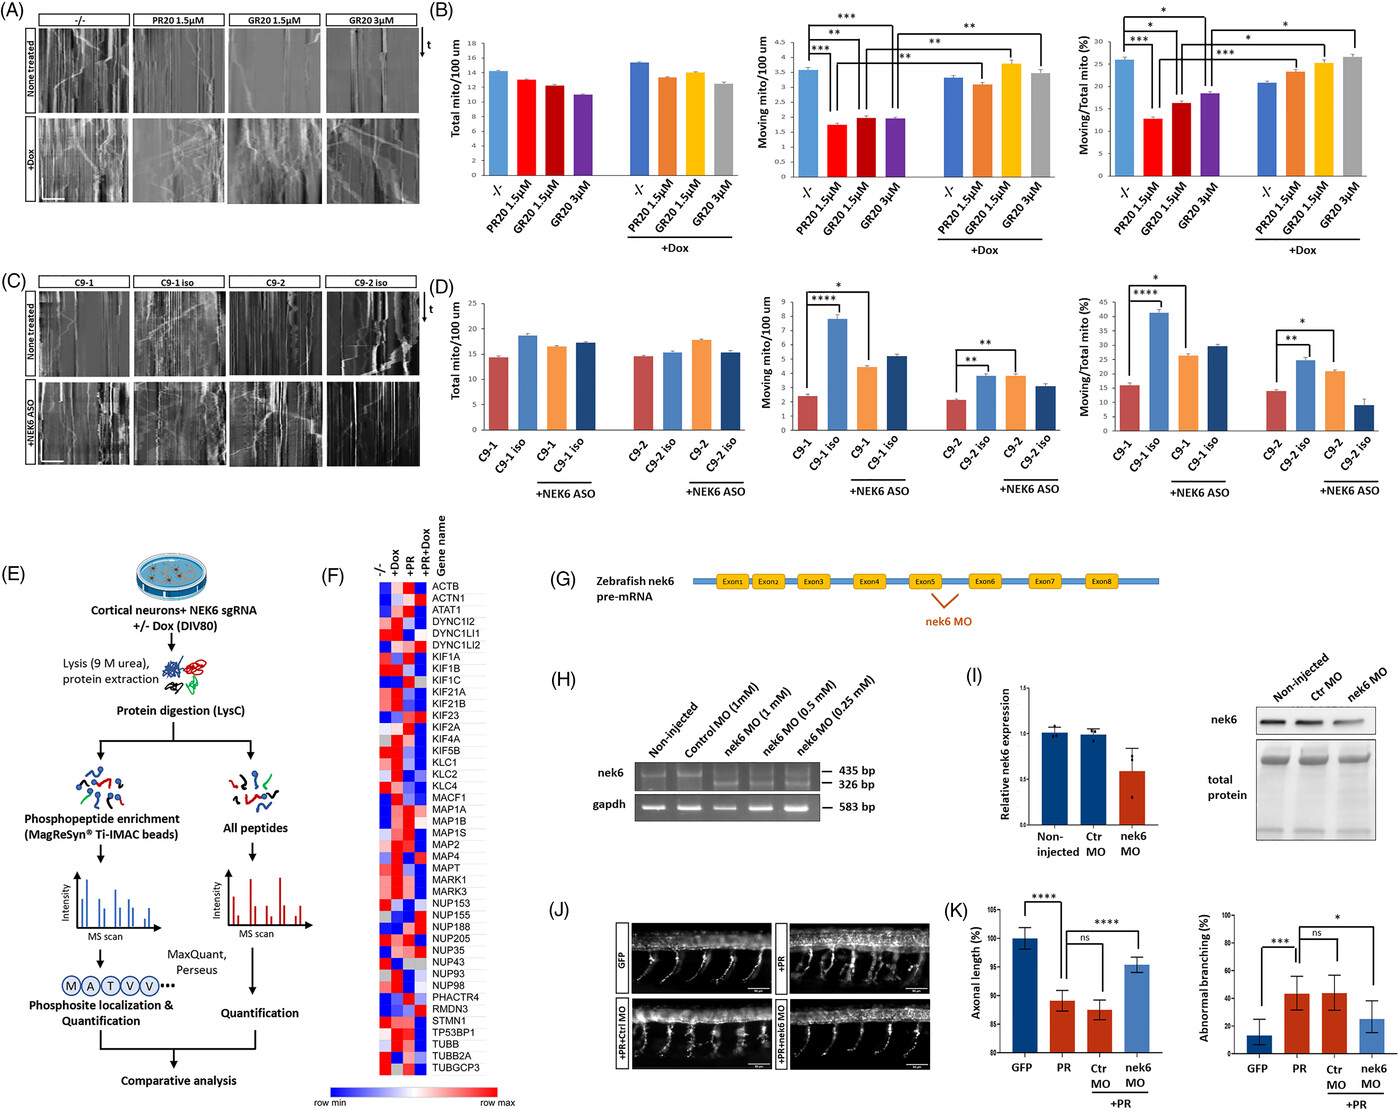
NEK6 interference prevents poly(PR) toxicity in vitro and in vivo. (A) Representative kymographs of axonal transport recording in iCas9-iPSC-derived cortical neurons obtained from iCas9-iPSC-derived cortical neurons transduced with NEK6 sgRNA loaded with Mito-Tracker-Red (-/- = no treatment; +PR20 = PR20 treatment; +GR20 = GR20 treatment; +Dox = 3 μg doxycycline treatment). (B) Quantification of total mitochondria, moving mitochondria and ratio of moving mitochondria to total mitochondria normalized to a neurite length of 100 μm during 200 s in (A). (C) Representative kymographs of cortical neurons from two different C9orf72 patient iPSC as well as the respective isogenic control iPSC-derived neurons treated with or without different NEK6 ASOs for 1 week. (D) Quantification of total mitochondria, moving mitochondria and ratio of moving mitochondria to total mitochondria normalized to a neurite length of 100 μm during 200 s in (C). (E) Schematic representation of the different steps to identify phosphorylation sites by mass spectrometry. The blue dots represent a phosphorylation site in proteins/peptides. The blue/red lines in the MS spectra represent site-determination. Interpretation of MS spectra involved both the identification of phosphopeptides and localization of the sites of phosphorylation. The final determination of phosphopeptides was calculated by referencing to the corresponding peptides from shot gun MS spectra. (F) Heatmap of identified phosphorylation sites in proteins involved in axonal transport and nucleocytoplasmic transport machineries. (G) The nek6 splice-blocking morpholino targets the exon5 intron5 splice junction of zebrafish nek6 pre-mRNA. (H) RT-PCR validation of morpholino-mediated nek6 modified splicing in zebrafish embryos at 30 hpf. Non-target morpholino at the highest concentration is used as standard control. Wild type nek6 is amplified as a 435 bp band, while aberrantly spliced nek6, induced by morpholino injection, is amplified as a 326 bp band. (I) Western blot validation of morpholino-mediated nek6 knockdown in zebrafish embryos at 6 hpf (normalized to Ponceau total protein staining). (J) Visualization of motor axons by immunohistochemistry (SV2 antibody) of 30 hours post fertilization (hpf) zebrafish embryos injected with 0.844 μM GFP mRNA, 0.844 μM poly(PR) mRNA, 0.844 μM poly(PR) mRNA plus 0.5 mM control morpholino or 0.844 μM poly(PR) mRNA plus 0.5 mM nek6 morpholino; scale bar = 50 μm. (K) Quantification of axonal length (data represent mean ± 95% CI; one-way ANOVA) and aberrant axonal branching (data represent mean ± 95% CI; logistic regression) of zebrafish embryos in the four conditions; n = 4 biological replicates. All axonal transport measurements were performed on cortical neurons at DIV = 80-85; Number of neurons wherein axonal transport was measured ≥15 per data point; Kymographs scale bar time (vertical): 35 s; scale bar distance (horizontal): 25 μm. Data were plotted as mean ± SEM. Statistical significance was evaluated with one-way ANOVA and post-hoc Tukey's test; *, **, ***, ****P values < 0.05, <0.01, <0.001, and <0.0001, respectively
Figure Data
Acknowledgments
This image is the copyrighted work of the attributed author or publisher, and
ZFIN has permission only to display this image to its users.
Additional permissions should be obtained from the applicable author or publisher of the image.
Full text @ Alzheimers Dement

