
Image
|
Figure Caption
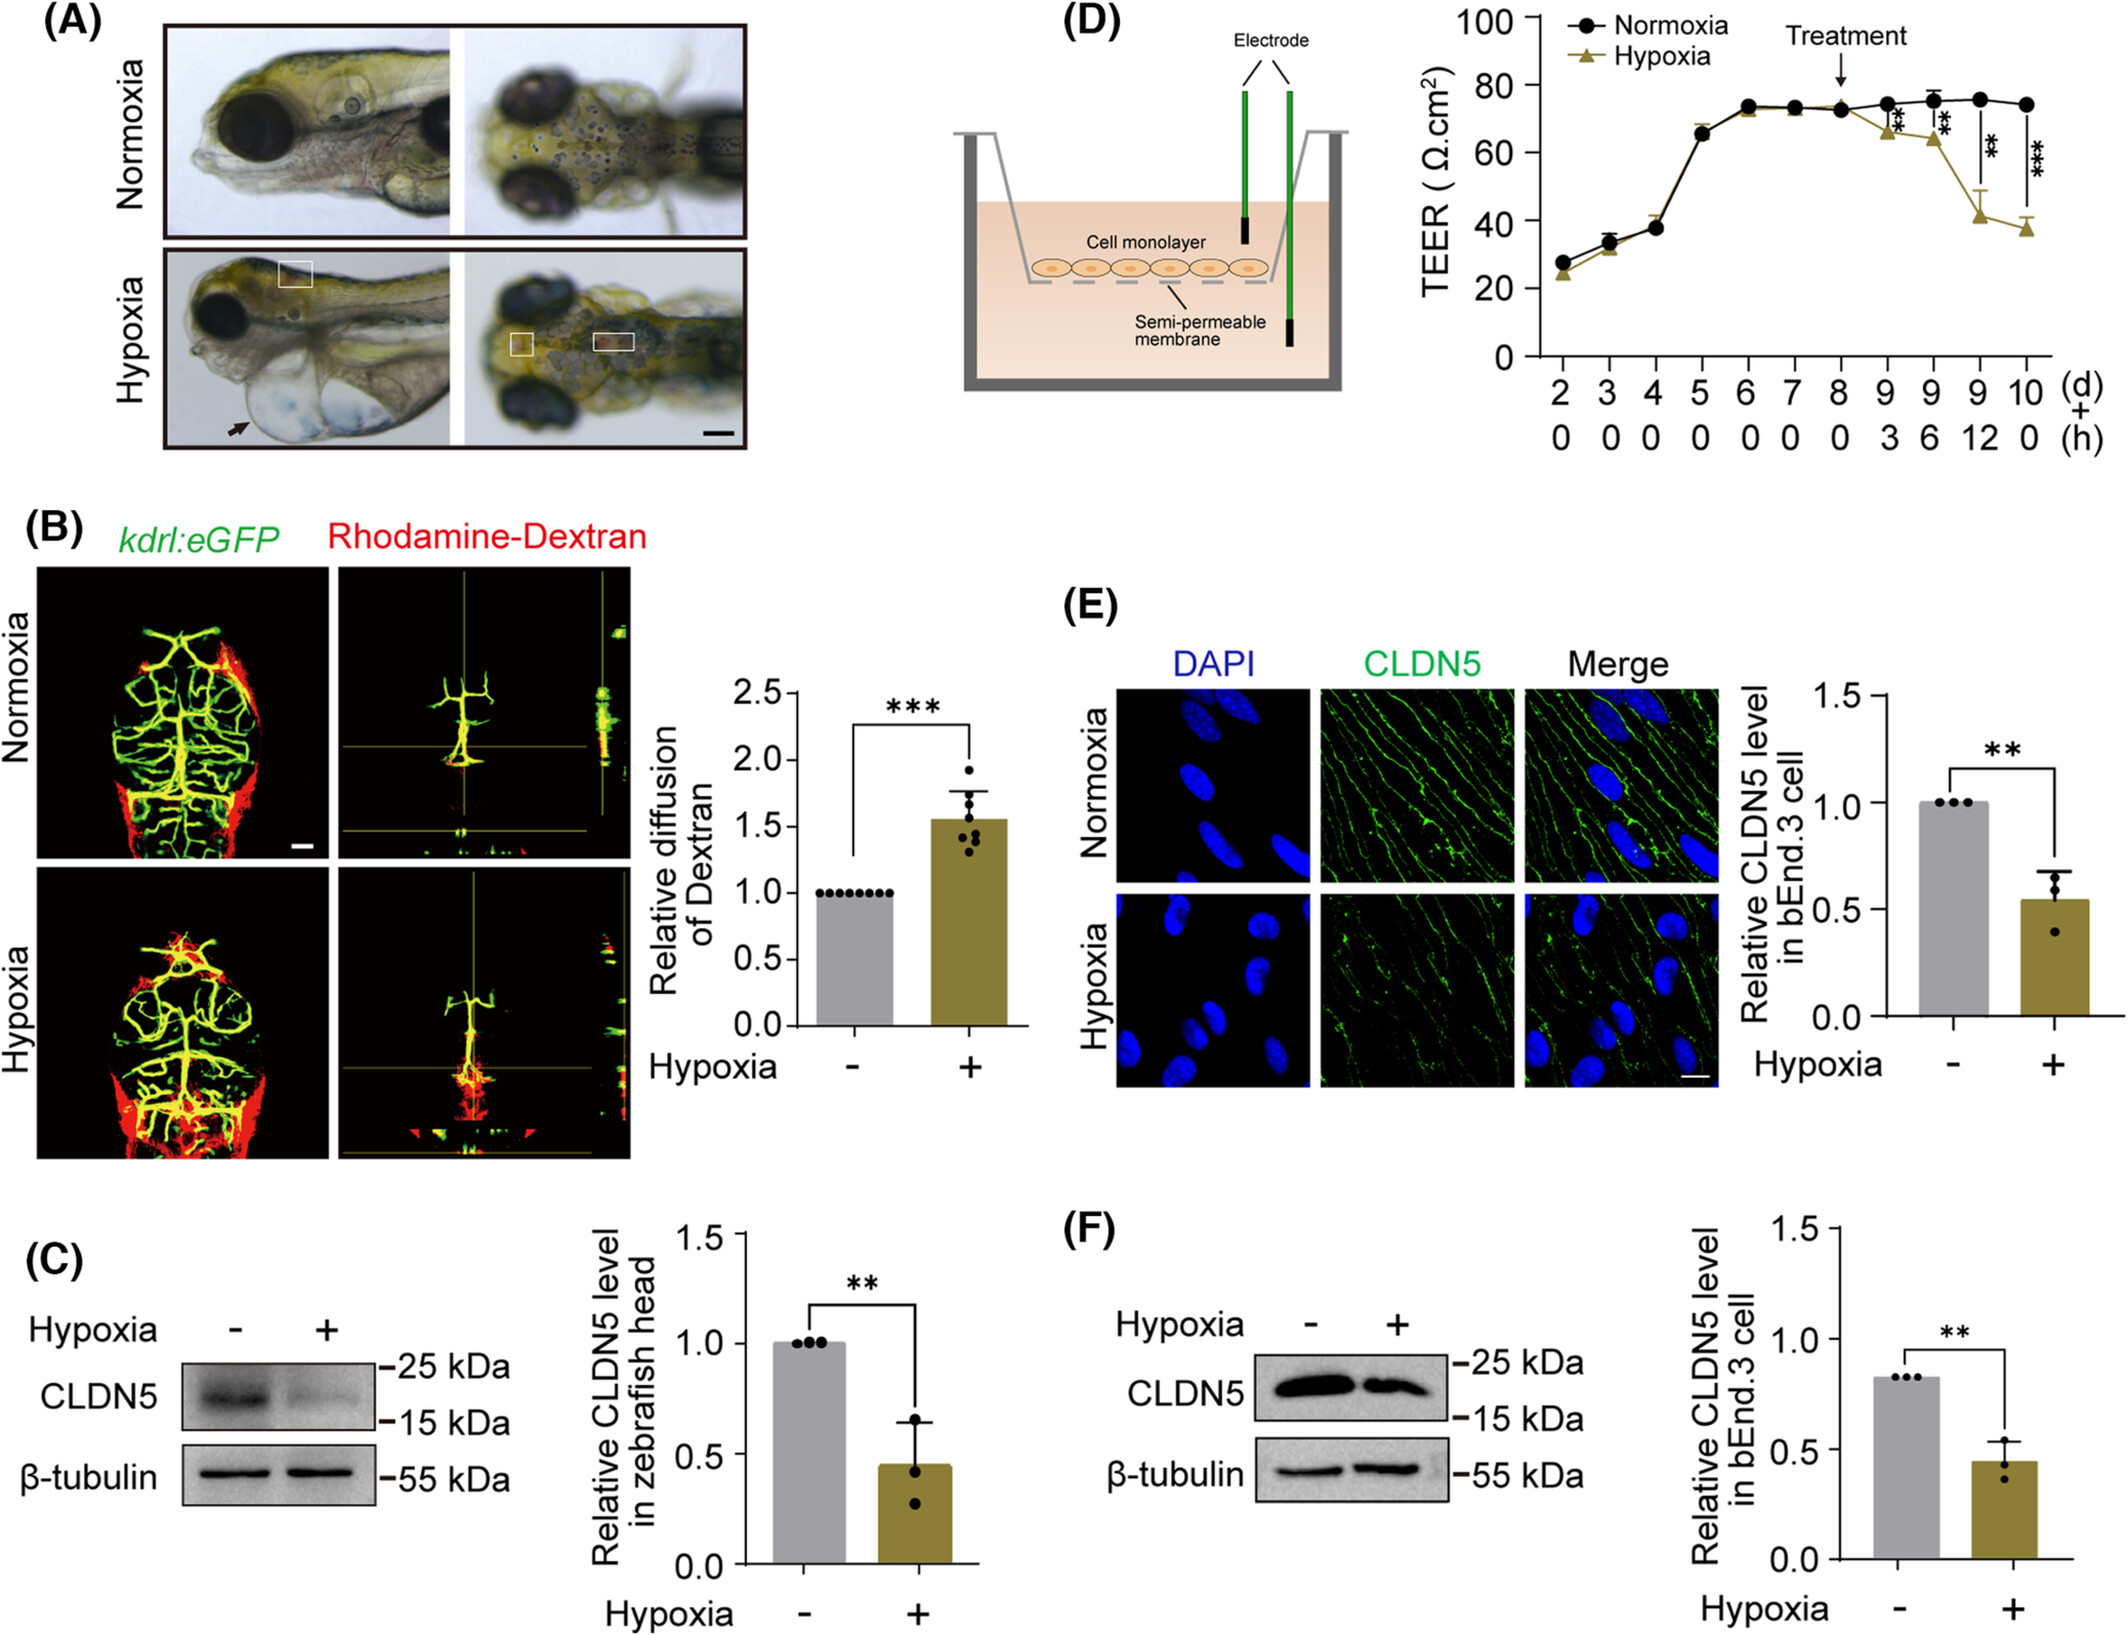
Fig. 1
Hypoxia treatment leads to damage of BBB both in vitro and in vivo. (A) Phenotypes of zebrafish were observed by microscope imaging. Black arrow indicates the sites of cardiac edema. Solid white boxes indicate the sites of brain hemorrhage. Scale bar: 200 μm. N = 23 fish per group. (B) The integrity of BBB was evaluated by cerebral angiography after hypoxia induction. N = 8 fish per group. Mean ± SD, Student's t-test, ***p < .0001. Scale bar: 50 μm. (C) The expression of CLDN5 protein in zebrafish head was detected by Western blotting. Mean ± SD, Student's t test, **p = .0075. N = 100 fish per group. (D) BBB permeability was assessed by measuring TEER. “Treatment” indicates the time point of hypoxia induction after the bEnd.3 cell monolayer reaches a stable TEER value. Mean ± SD, Student's t test, normoxia vs. hypoxia (3 h), **p = .0016; normoxia vs. hypoxia (6 h), **p = .0069; normoxia vs. hypoxia (12 h), **p = .0088; normoxia vs. hypoxia (24 h), ***p = .0007. (E) Immunofluorescence staining analyses were performed to investigate the expression of CLDN5 in bEnd.3 cells. Mean ± SD, Student's t-test, **p = .004, Scale bar: 10 μm. (F) Western blotting analyses showed the expression level of CLDN5 protein in bEnd.3 cells. Mean ± SD, Student's t-test, **p = .0018.
Acknowledgments
This image is the copyrighted work of the attributed author or publisher, and
ZFIN has permission only to display this image to its users.
Additional permissions should be obtained from the applicable author or publisher of the image.
Full text @ FASEB J.