Image
Figure Caption
Fig. 1
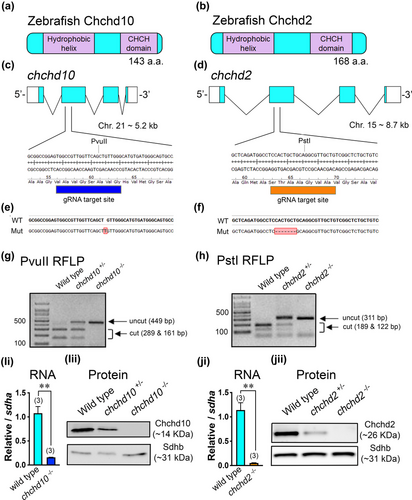
Generation of chchd10−/− and chchd2−/− zebrafish lines. Schematic representation of the zebrafish proteins Chchd10 (a) and Chchd2 (b). (c) chchd10 gene structure and guide RNA (gRNA) target site. (d) chchd2 gene structure and gRNA target site. (e) CRISPR-induced chchd10−/− mutant (mut) line. (f) CRISPR-induced chchd2−/− mutant (mut) line. (g) Restriction fragment length polymorphism (RFLP) screening method using PvuII which is lost in the chchd10−/− mutant. (h) RFLP screening using PstI which is lost in the chchd2−/− mutant. (Ii) RT-qPCR of the chchd10 transcript using wild type and chchd10−/− cDNA. A reduction in chchd10 (t-test, p = .003, relative to sdha) was observed in chchd10−/− (data represents as mean ± SEM). (Iii) Immunoblot using wild type, chchd10+/−, and chchd10−/− whole brain lysate. Sdhb was used as a loading control. (Ji) RT-qPCR of the chchd2 transcript from wild type and chchd2−/− cDNA. A significant reduction in chchd2 (t-test, p = .002, relative to sdha) was observed in chchd2−/− (data represents mean ± SEM). (Jii) Brain lysate immunoblot from wild type, chchd2+/−, chchd2−/− model. Sdhb was used as a loading control. Significant differences from wild type larval data are represented by either a single asterisk (p < .05) or double asterisk (p < .01), and samples sizes (n) are in parentheses.
Acknowledgments
This image is the copyrighted work of the attributed author or publisher, and
ZFIN has permission only to display this image to its users.
Additional permissions should be obtained from the applicable author or publisher of the image.
Full text @ Dev. Neurobiol.

