
Image
|
Figure Caption
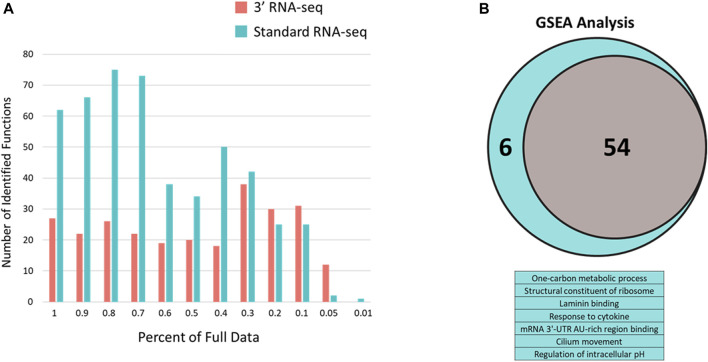
FIGURE 5
Number of enriched functions identified with 3′ and standard RNA-seq DEG lists using sparse data and q-value defined data.
Acknowledgments
This image is the copyrighted work of the attributed author or publisher, and
ZFIN has permission only to display this image to its users.
Additional permissions should be obtained from the applicable author or publisher of the image.
Full text @ Front Bioinform