
Image
|
Figure Caption
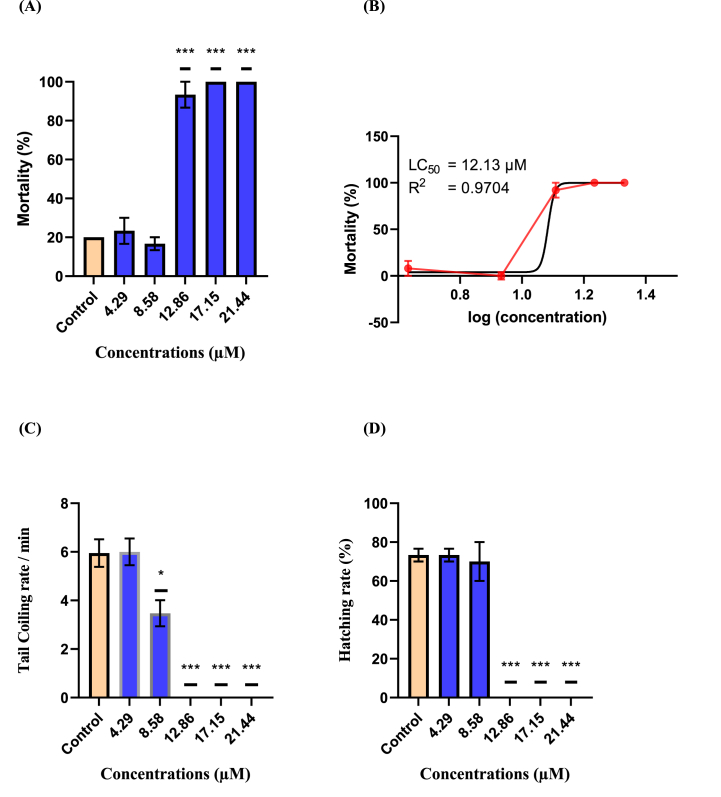
Fig. 6
Toxicity profiles of zebrafish embryos at 24 to 72 hpf based on (A) mortality rate, (B) LC50, (C) spontaneous tail coiling (STC), and (D) hatching rate. Results are expressed as mean ± standard error of the mean (SEM) (n = 30). Statistical analysis was performed using the one-way analysis of variance (ANOVA) test and a Tukey post-test. (*p < 0.05, **p < 0.01, ***p < 0.001; the p-value is the marginal significance level within a statistical hypothesis test that indicates the probability of a particular event occurring.).
Acknowledgments
This image is the copyrighted work of the attributed author or publisher, and
ZFIN has permission only to display this image to its users.
Additional permissions should be obtained from the applicable author or publisher of the image.
Full text @ Heliyon