
Image
|
Figure Caption
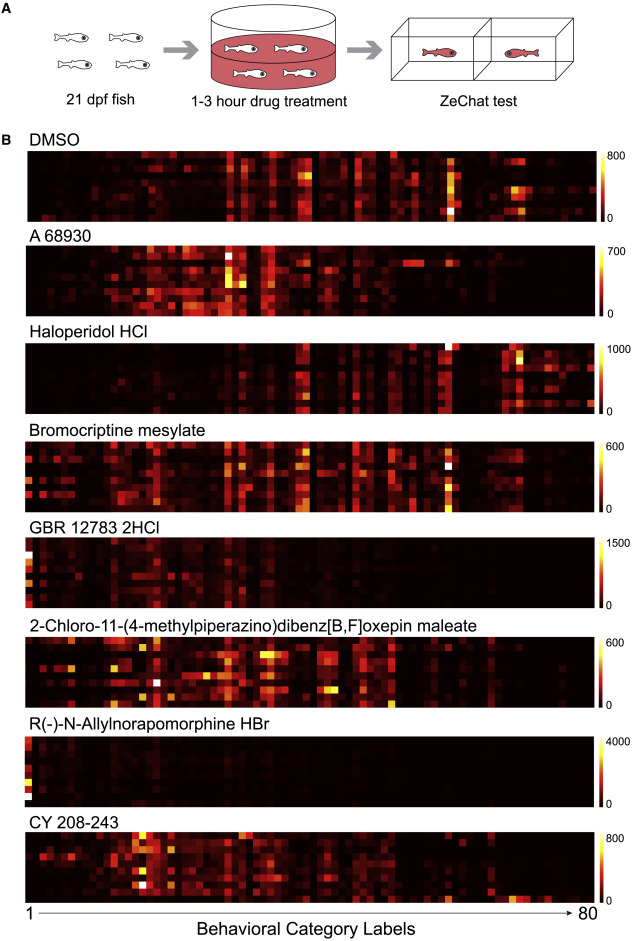
Fig. 4 Neuroactive compounds produce highly reproducible behavioral fingerprints (A) A schematic of the screening procedure. (B) Behavioral fingerprints of individual fish treated by different chemicals. Each row represents the behavior fingerprint of an individual fish. Each square represents the total number of times a fish is assigned to a behavioral category. Horizontal axis: the 80 behavioral categories. Color bar: cumulated number of times a fish is assigned to a behavioral category.
Acknowledgments
This image is the copyrighted work of the attributed author or publisher, and
ZFIN has permission only to display this image to its users.
Additional permissions should be obtained from the applicable author or publisher of the image.
Full text @ Cell Rep Methods