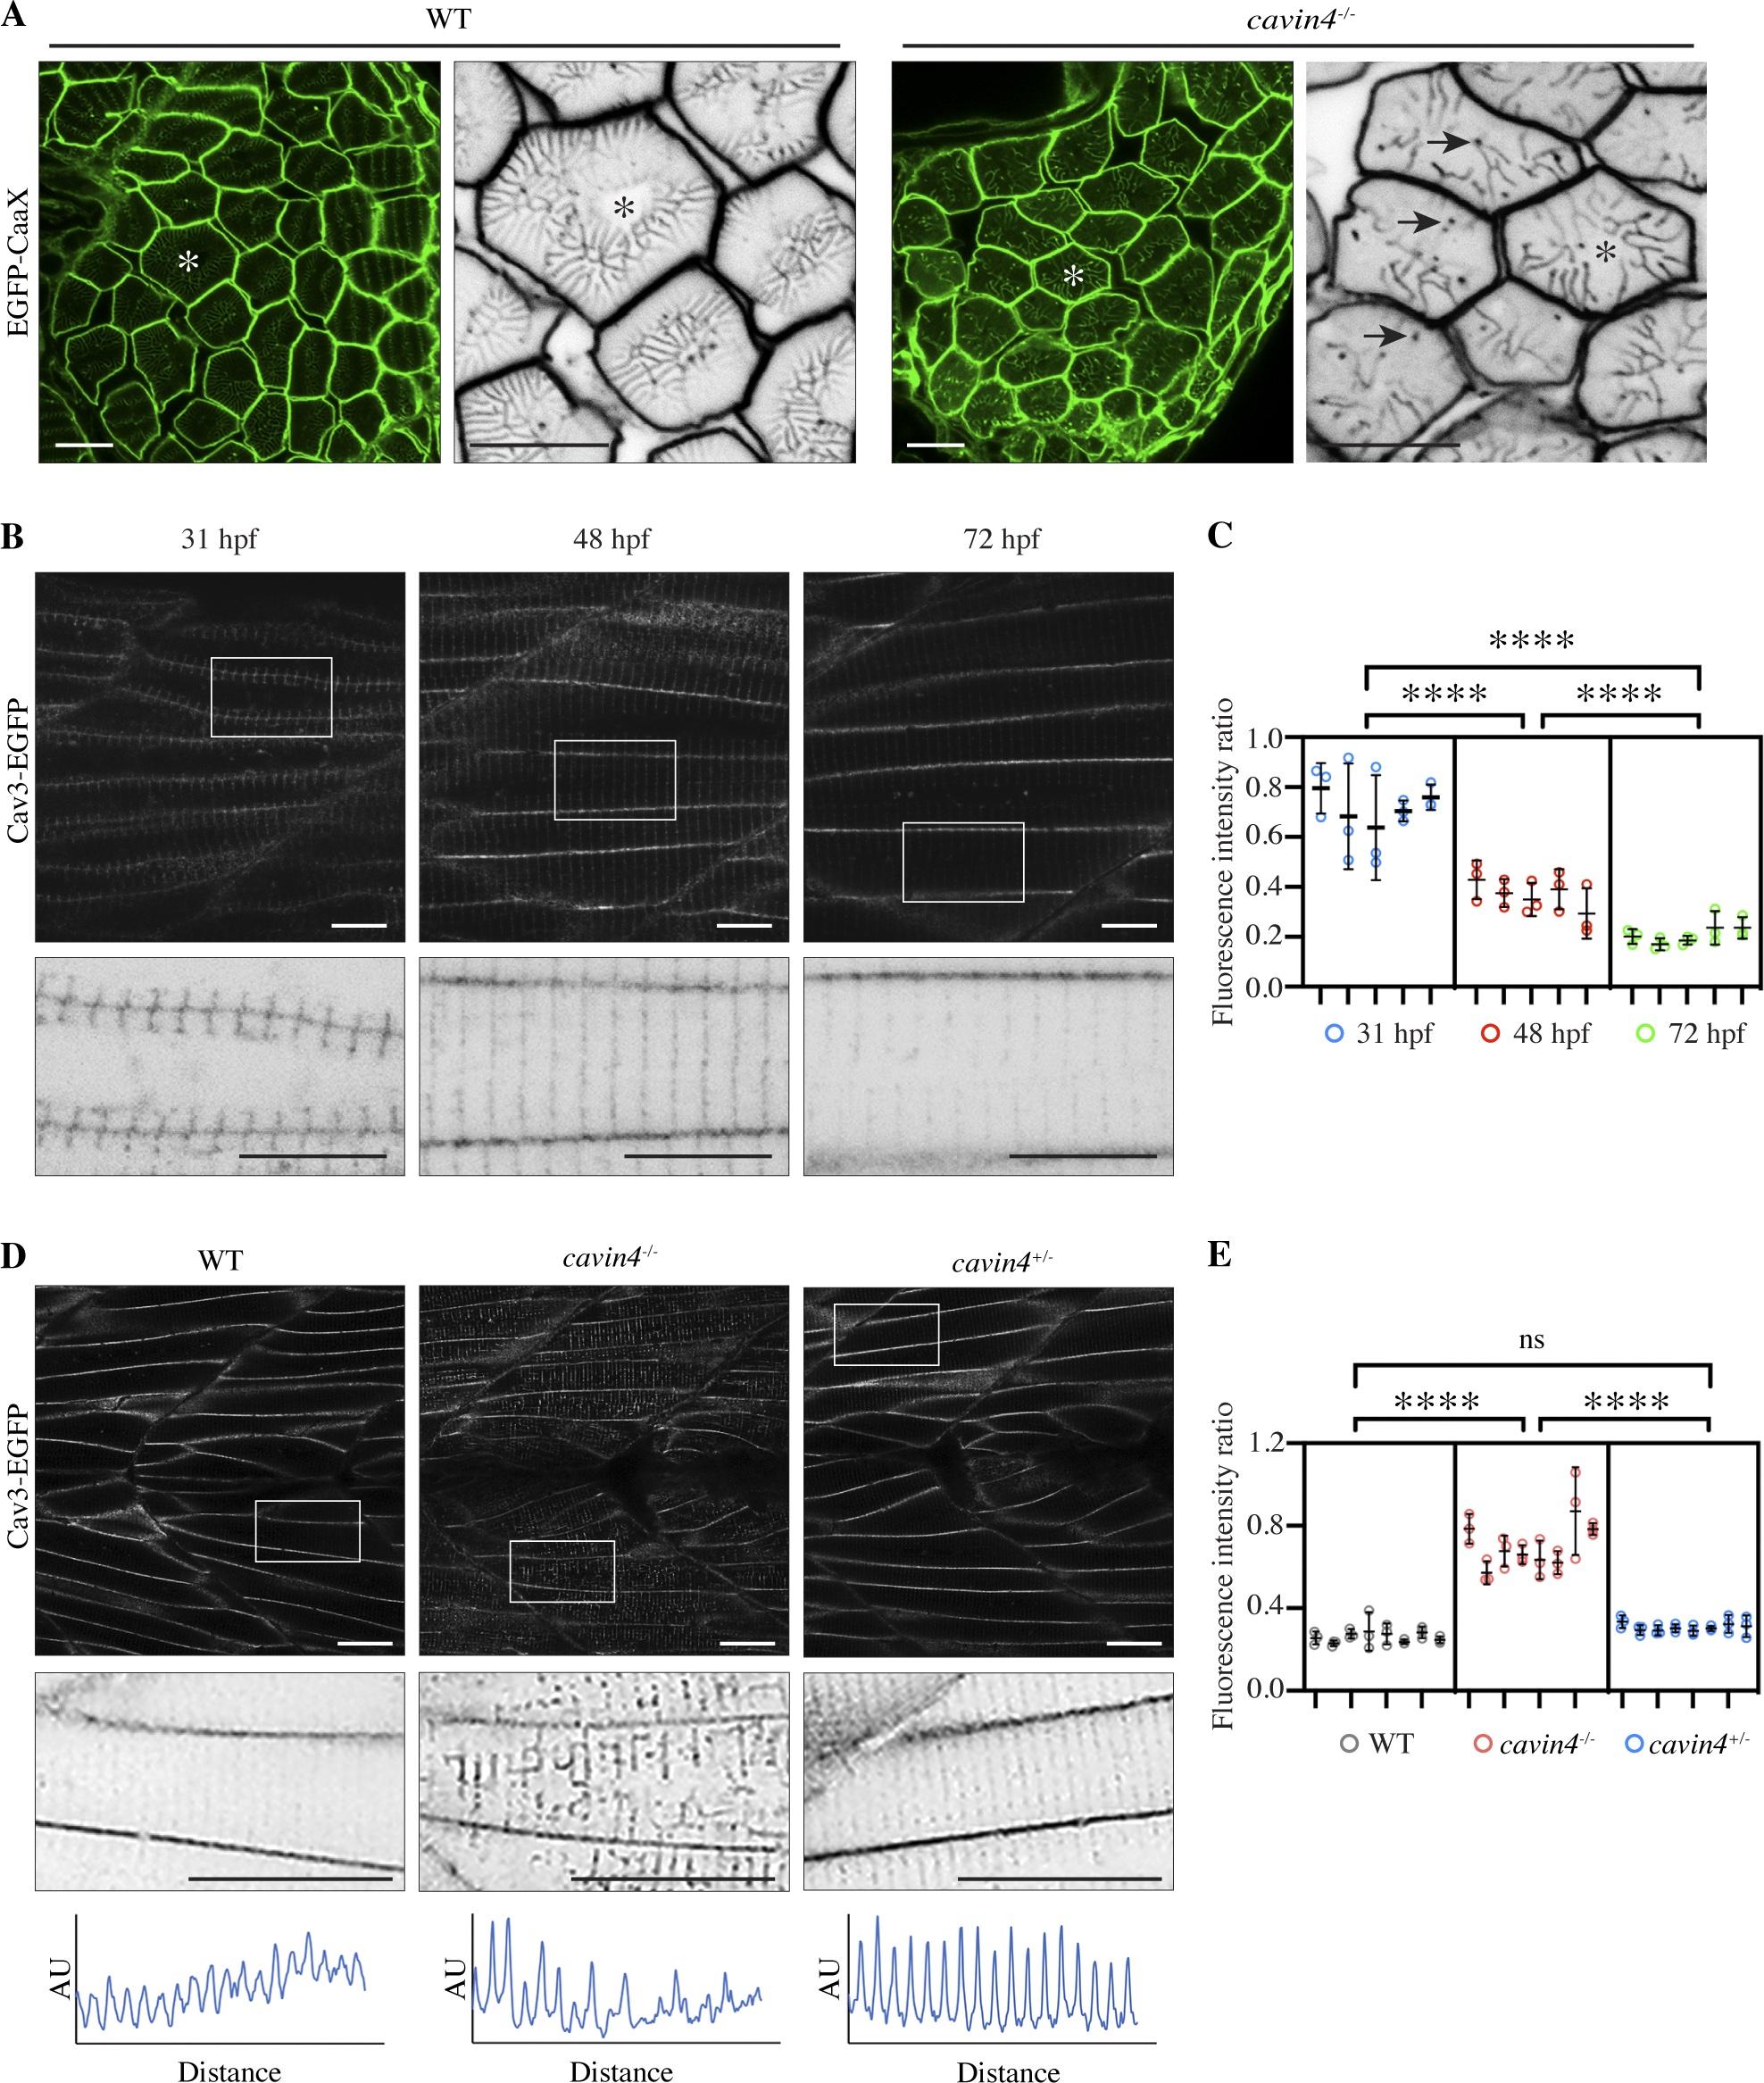
Fig. 3 Cavin4−/− zebrafish embryos have an aberrant T-system and increased association of Cav3 with T-tubules. (A) Confocal images of EGFP-CaaX in transverse sections of WT and cavin4−/− 5-dpf embryos. Asterisk indicates corresponding muscle fiber in magnified inverted image. Arrows indicate abnormal puncta in cavin4−/− muscle. Scale bars: 10 µm. (B) Confocal images of Cav3-EGFP in live zebrafish embryos at 31, 48, and 72 hpf. Inverted images in bottom panel show boxed areas. Scale bars: 10 µm. (C) Ratio of T-tubule to sarcolemma fluorescence intensity (n = 5 embryos for each time point in B, n = 3 areas per embryo represented as colored circles; nested one-way ANOVA with multiple-comparison Tukey’s test). ****, P ≤ 0.0001. (D) Confocal images of Cav3-EGFP in live 5-dpf WT, cavin4−/−, and cavin4+/− (sibling) embryos. Inverted images show magnification of boxed areas. Box scan quantitation of boxed area (bottom panel; AU, arbitrary units) highlights loss of T-tubule periodicity in cavin4−/− muscle. Scale bars: 10 µm. (E) Ratio of T-tubule to sarcolemma fluorescence intensity in WT, cavin4−/−, and cavin4+/− muscle fibers (n = 8 embryos per genotype from two independent clutches, n = 3 areas per embryo represented as colored circles; nested one-way ANOVA with multiple-comparison Tukey’s test). ****, P ≤ 0.0001. Error bars represent mean ± SD.
Image
Figure Caption
Figure Data
Acknowledgments
This image is the copyrighted work of the attributed author or publisher, and
ZFIN has permission only to display this image to its users.
Additional permissions should be obtained from the applicable author or publisher of the image.
Full text @ J. Cell Biol.

