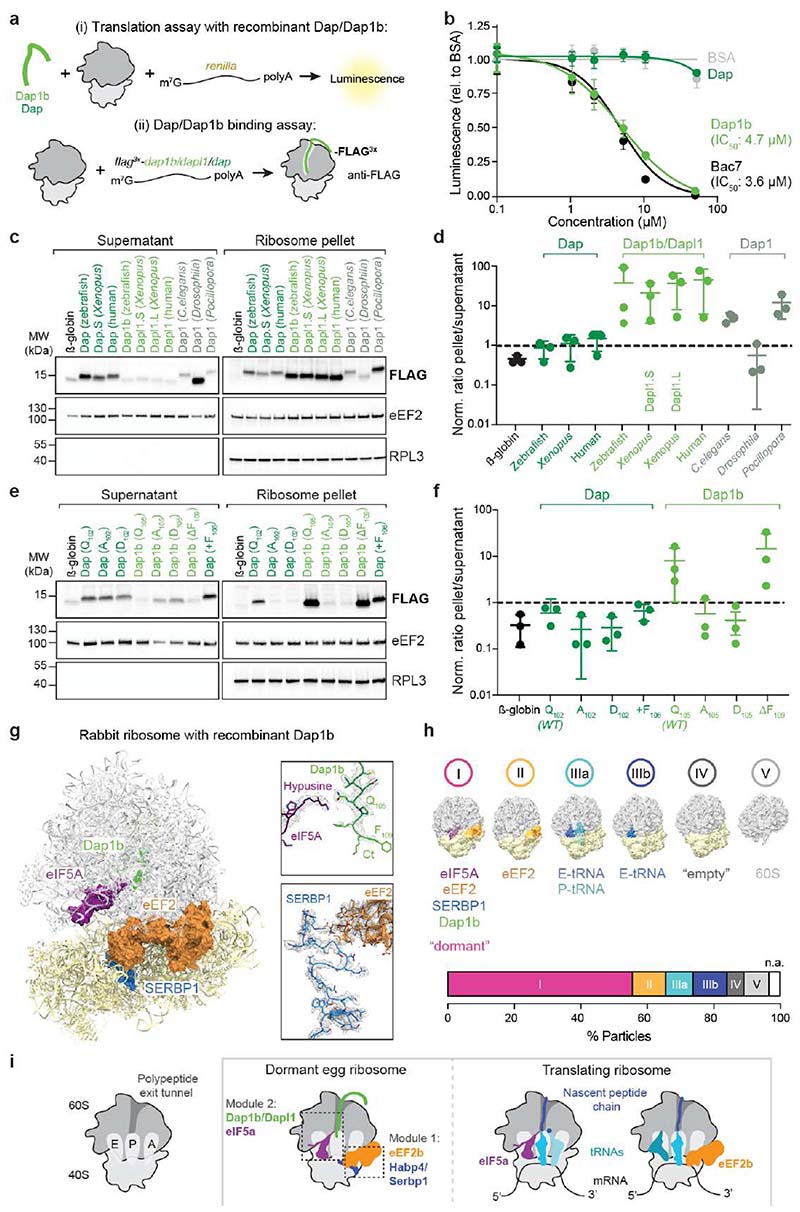
Fig. 4
a, Scheme of the assays performed in rabbit reticulocyte lysate (RRL). (Top) Recombinant zebrafish Dap or Dap1b and in vitro synthesized renilla mRNA were added to RRL. Translation was assessed by measuring Luciferase activity. (Bottom) In vitro synthesized mRNAs encoding FLAG-tagged proteins were translated in RRL. Ribosomes were pelleted and proteins were quantified by Western blot. b, IC50 analyses of Dap1b and Dap (a, top). Bac7 and BSA were used as controls (n = 4; plot shows mean ± standard deviation (SD)). c, Ribosome binding assays of in vitro translated proteins (a, bottom). β-globin was used as control. eEF2 and RPL3 were used as a readout of fractionation and for normalization. Total reaction is shown in Extended Data Fig. 9a. d, Quantification of the blots shown in c. Values are normalized to loading (eEF2 or RPL3) and levels of the FLAG-tagged factors (n = 3). e, Ribosome binding assays with β-globin (control), wild-type and mutant versions of zebrafish Dap and Dap1b. Total reaction is shown in Extended Data Fig. 9b. f, Quantification of the blots shown in e (n = 3). g, Structure of the rabbit ribosome with zebrafish Dap1b. Ribosome-associated factors are shown as surface representations. Densities (in mesh) are shown on the right. Critical amino acids are indicated. Ct, C-terminus. h, Distribution of ribosomal particles from RRL among the classes obtained with cryoDRGN48. Representative filtered maps of the major classes (top) with superimposed colored densities for eEF2, eIF5A and tRNAs (Supplementary Table 3; n.a refers to “non-assigned” particles). i, Scheme depicting the main features of the dormant ribosomes identified in this study. (Left) Cartoon of important functional sites of the ribosome. (Middle) Dormant ribosomes are associated with four factors. (Right) Translating ribosomes. For b, d and f, n are independent experiments. In d and f, data are scatter plots with mean ± SD, and statistical analysis was performed with Kruskal-Wallis followed by Dunn’s two-sided test. Uncropped images of membranes shown in c and e are provided in Supplementary Fig. 2a, b.

