
|
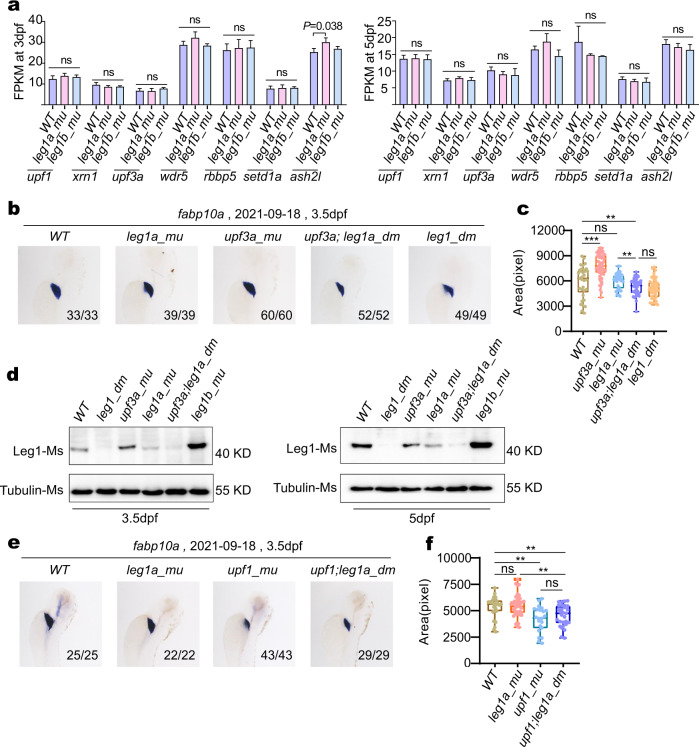
Fig. 4
a Statistical analysis of transcript counts (FPKM) of the genes encoding components of the NMD pathway and COMPAS complex in RNA-seq samples obtained from WT, leg1a_mu single and leg1b_mu single mutant embryos at 3 dpf and at 5 dpf, respectively. b, c Representative images showing the WISH result using the fabp10a probe (b) and the statistical analysis of liver sizes (c) in the WT, leg1a_mu, upf3a_mu, upf3a;leg1a_dm and leg1_dm embryos at 3.5 dpf. d Western blot of Leg1 protein in different genotypes at 3.5 dpf and 5 dpf, respectively. Tubulin, loading control. e, f Representative images showing the WISH result using the fabp10a probe (e) and the statistical analysis of liver sizes (f) in the WT, leg1a_mu, upf1_mu, and upf1;leg1a_dm embryos at 3.5dpf. b, e Top: the date of experiments performed; bottom right: number of embryos showing the phenotype over total embryos examined. ns, no significance; **P < 0.01; ***P < 0.001.