IMAGE

FIGURE 1

ID
ZDB-IMAGE-230617-26
Source
Figures for Morsli et al., 2023
Image
Figure Caption

FIGURE 1

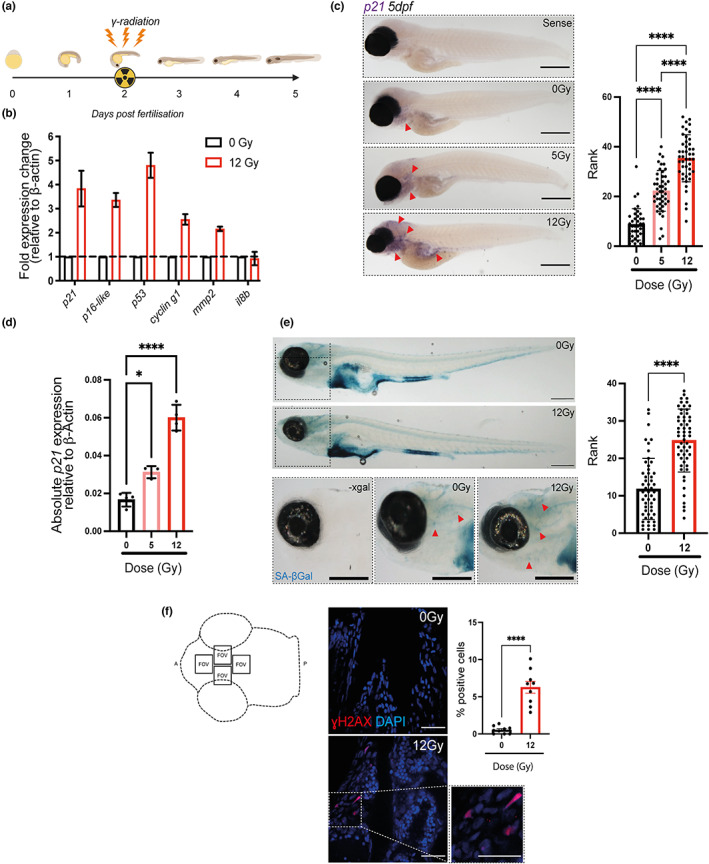
Irradiation of zebrafish larvae upregulates multiple markers of senescence. (a) Diagram depicting the experimental protocol used to induce senescence in zebrafish larvae using Cs137 ɣ‐Irradiation at 2 dpf and assessing markers of senescence at 5 dpf. (b) Quantitative PCR (qPCR) of whole zebrafish mRNA at 5 dpf following 12 Gy irradiation to determine gene expression of p21 (cdkn1a), p16‐like (cdkn2a/b), p53, cyclin‐g1, mmp2 and IL8b. Fold expression was calculated by 2−ΔCt relative to β‐actin. mRNA was pooled from 50 zebrafish for each independent repeat. The graph represents the mean ± SEM of 3 repeats. (c) Transmitted light photomicrographs of a whole‐mount in situ hybridisation (WISH) for p21 (cdkn1a) mRNA expression at 5 dpf following 5 or 12 Gy irradiation at 2 dpf (left panels). Areas of increased staining include pharyngeal arches, brain and intestine, depicted with red arrows. Scale 250 μm. Quantification of ISH photomicrographs through blind ranking such that fish with the strongest staining are ranked highest (right panel). Data were examined by Kruskal–Wallis test with Dunn's multiple comparisons (N = 45). (d) Quantitative qPCR of whole zebrafish mRNA at 5 dpf following irradiation at 5 and 12 Gy to determine expression of p21. Data expressed as expression relative to GAPDH and analysed by one‐way ANOVA and Sidak's multiple comparisons test. (e) Photomicrographs of zebrafish at 5 dpf stained for senescence‐associated β‐Galactosidase (SA‐βGal) activity. Representative examples of the head region are also displayed on the left. Scale 200 μm (Left panels). Quantification of SA‐βGal activity in the head region by blind ranking is on the left (n = 55) (right panel). Data were examined by Kruskal–Wallis test with Dunn's multiple comparisons (f) Confocal fluorescence photomicrographs (Scale 25 μm) and quantification of ɣH2AX immunofluorescence in the ventral zebrafish head regions (areas depicted in the cartoon in the left panel) a minimum of 600 cells/fish were counted. For each fish, 4 fields of view and 3 individual z planes, 10 μM apart were analysed. At least 9 fish were analysed across three independent repeats. Data represented as mean ± SEM (N = 9) and examined by unpaired t‐test. Significant differences displayed as **p < 0.01; ****p < 0.0001. a, Anterior; p, posterior; FOV, field of view.

Acknowledgments
This image is the copyrighted work of the attributed author or publisher, and ZFIN has permission only to display this image to its users. Additional permissions should be obtained from the applicable author or publisher of the image. Full text @ Aging Cell