
|
Fig. 2
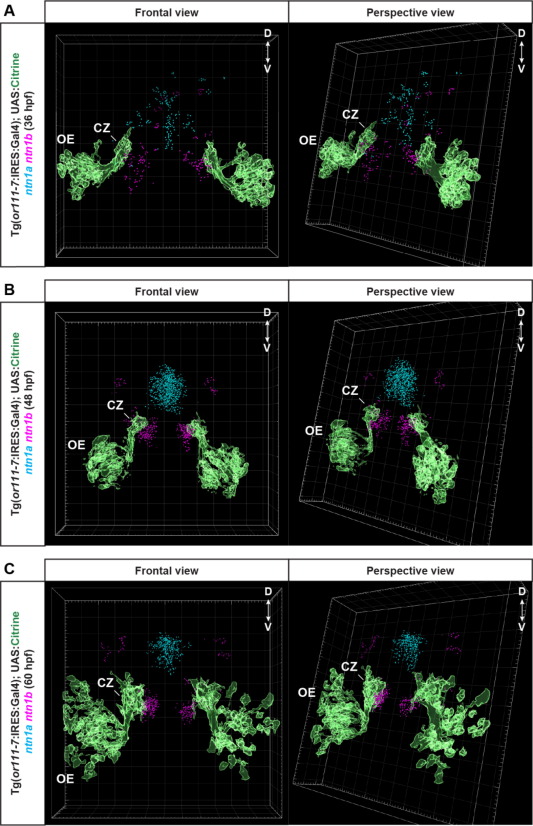
Fig. 2. Ntn1a and ntn1b expression projected onto models of the developing zebrafish olfactory bulb. (A) Model of a 36 hpf zebrafish olfactory system showing consensus ntn1a and ntn1b expression in frontal (left) or perspective (right) views. Ntn1a expression in cyan, ntn1b expression in magenta, and Tg(or111-7:IRES:Gal4);UAS:Citrine expression in green. Gridlines in the frame are spaced at 10 µm. (B) Model of a 48 hpf zebrafish olfactory system showing consensus ntn1a and ntn1b expression from frontal and perspective views. (C) Model of a 60 hpf zebrafish olfactory system showing consensus ntn1a and ntn1b expression from frontal and perspective views.