
|
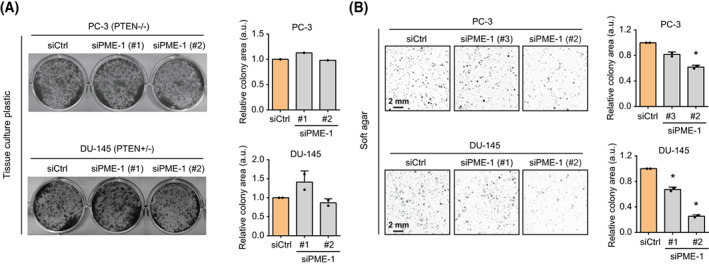
Fig. 2
PME‐1 promotes anchorage‐independent growth of prostate cancer cells. (A) The effect of PME‐1 depletion, using two independent siRNAs, was investigated by colony formation assays (10 days of growth) in two PTEN‐deficient PCa cells lines PC‐3 and DU‐145. (Left) Representative images of the wells. (Right) Bar graphs depicting the quantified data, mean ± SD of one (PC‐3) or two (DU‐145) independent experiments. (B) The effect of PME‐1 knock‐down on anchorage‐independent growth in soft agar assays (14 days of growth) in both PC‐3 and DU‐145 cells. (Left) Representative images depicting the colonies. (Right) Bar graphs displaying the quantified data, mean ± SD of two independent experiments. *P < 0.05, Welch's t‐test.