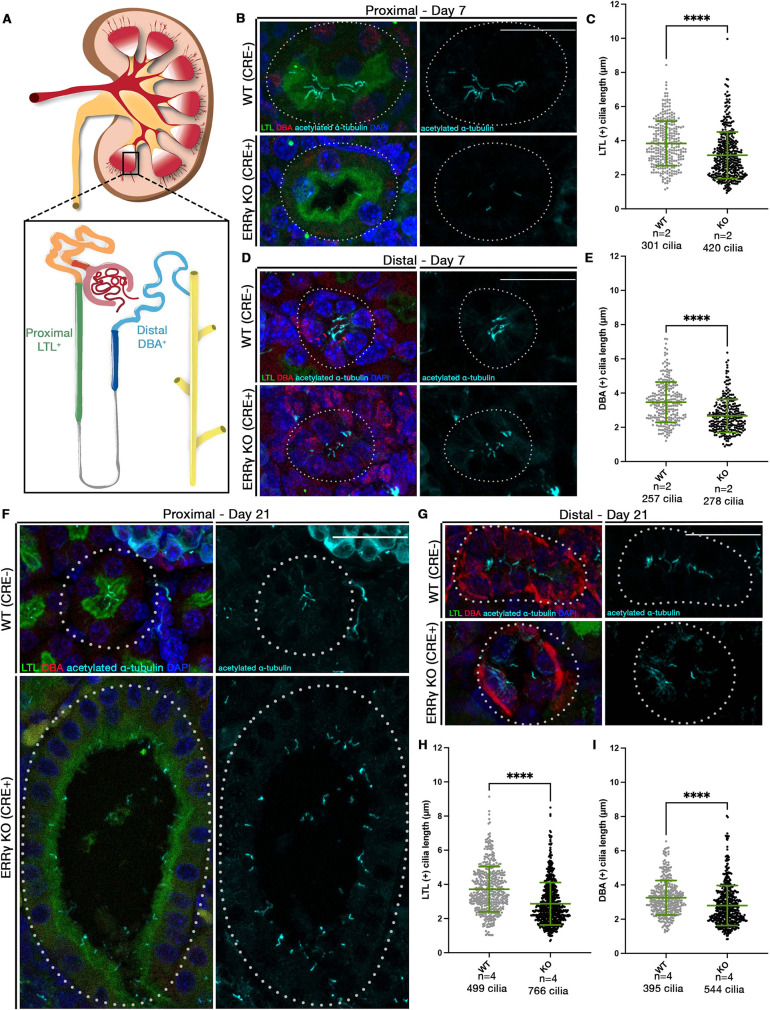
Fig. 5.
Murine ERRγ functions in ciliary development. (A) Schematic of mammalian kidney and nephron. Proximal segments are LTL+ and distal segments are DBA+. (B,D) IF for α-tubulin in LTL+ (B) and DBA+ (D) tubules (dotted outline) in 7-day-old animals. (C,E) Cilia length in LTL+ (C) and DBA+ (E) 7-day old animals. Number of animals given as n and number of cilia measured. (F,G) IF for α-tubulin in LTL+ (F) and DBA+ (G) tubule (dotted outlines) in 21-day-old animals. (H,I) Cilia length in LTL+ (H) and DBA+ (I) 21-day old animals. Number of animals given as n and the number of cilia measured. Data are mean±s.d. ****P<0.0001 (unpaired t-test). Scale bars: 25 µm.

