
Image
|
Figure Caption
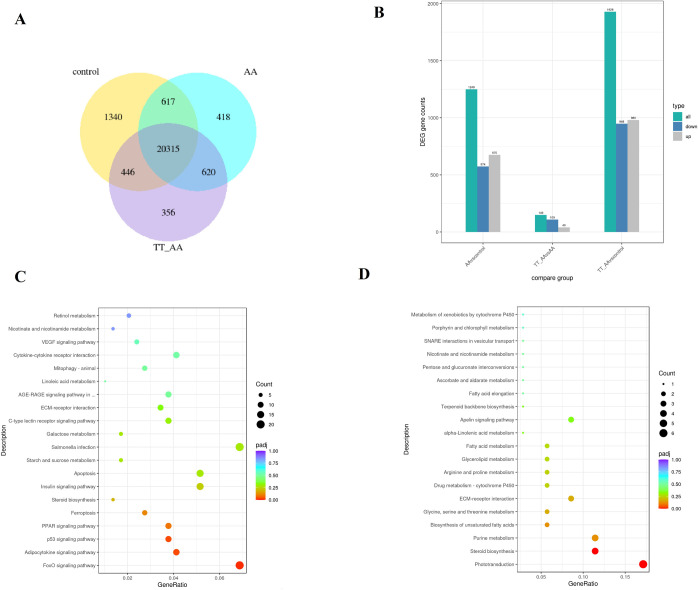
Fig 5 RNA-seq data analysis.
(A) Venn diagram of gene counts expressed. (B) Significant DEG counts. (C) The KEGG pathway enrichment of DEGs between AA and control. (D) The KEGG pathway enrichment of DEGs between AA and AA _TT.
Acknowledgments
This image is the copyrighted work of the attributed author or publisher, and
ZFIN has permission only to display this image to its users.
Additional permissions should be obtained from the applicable author or publisher of the image.
Full text @ PLoS One