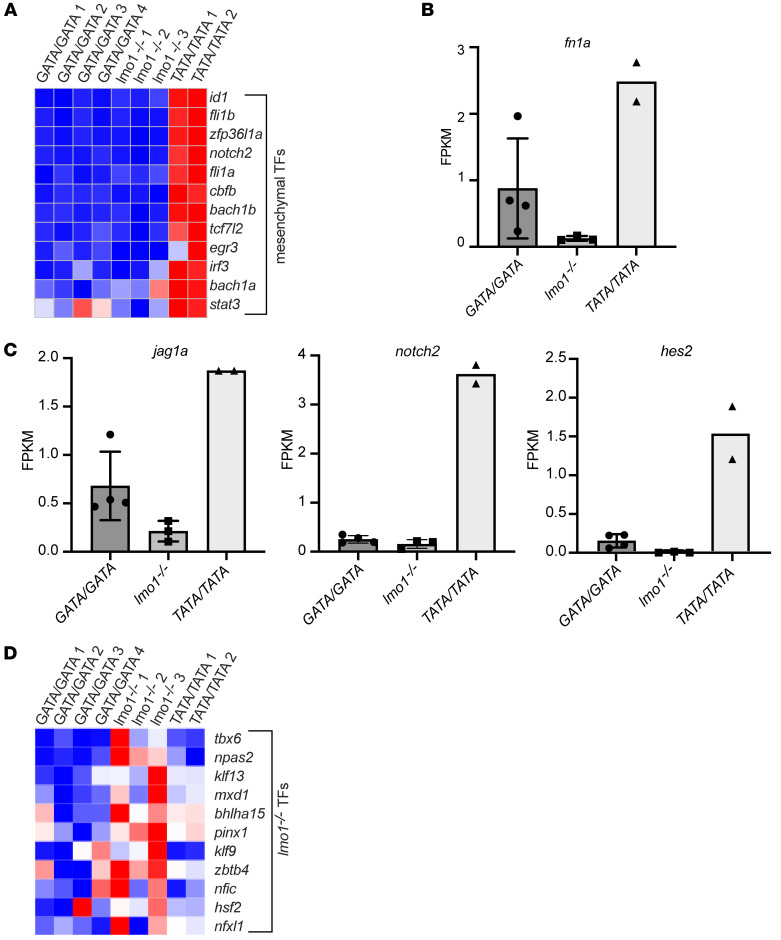
Figure 5
(A) Heatmap image based on RNA-Seq data analysis showing the indicated genes of the mesenchymal CRC, which are upregulated in the MYCN-induced neuroblastomas arising in the TATA/TATA background, but not in the lmo1–/– background, compared with the GATA/GATA zebrafish. (B) Relative mRNA expression levels of the mesenchymal neuroblastoma phenotype marker fn1a in neuroblastoma arising in zebrafish with the indicated genotypes (GATA/GATA, n = 4; lmo1–/–, n = 3; and TATA/TATA, n = 2). (C) Relative mRNA expression levels of NOTCH pathway genes, including jag1a, notch2, and hes2, in neuroblastomas arising in zebrafish from the indicated genotypes (GATA/GATA, n = 4; lmo1–/–, n = 3; and TATA/TATA, n = 2). (D) Heatmap of transcription factors exclusively upregulated in MYCN-driven neuroblastomas from the lmo1–/– line. TFs; transcription factors.

