
|
Figure 3
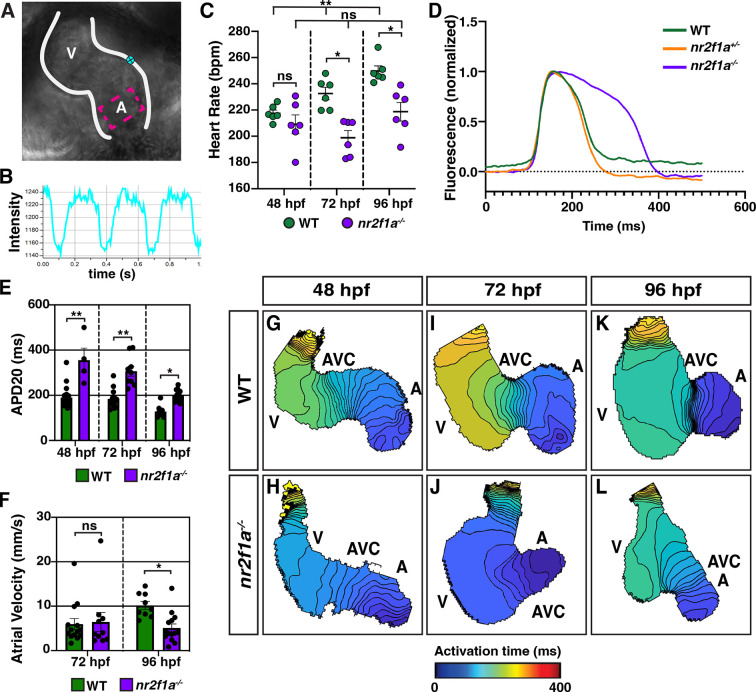
(A) Schematic of point placements to measure heart rate (cyan) and action potential duration at 20% repolarization (APD20) (magenta) in a 48 hr post-fertilization (hpf) heart. (B) Representative kymograph used to analyze heart rate in wild-type (WT) and nr2f1a mutant embryos. (C) Quantification of heart rate in WT and nr2f1a mutant embryos; 48 hpf: WT (n=6), nr2f1a-/- (n=6); 72 hpf: WT (n=6), nr2f1a-/- (n=6); 96 hpf: WT (n=6), nr2f1a-/- (n=6). (D) Representative atrial action potentials of WT, nr2f1a+/-, and nr2f1a-/- embryos at 96 hpf. (E) APD20 in WT and nr2f1a-/- hearts; 48hpf: WT (n=21), nr2f1a-/- (n=4); 72 hpf: WT (n=13), nr2f1a-/- (n=9); 96 hpf: WT (n=9), nr2f1a-/- (n=14). (F) Atrial velocity in WT and nr2f1a-/- hearts; 72 hpf: WT (n=13), nr2f1a-/- (n=9); 96 hpf: WT (n=9), nr2f1a-/- (n=14). (G–L) Representative isochronal maps illustrating the positions of the depolarizing wave front in 5 ms intervals for WT and nr2f1a-/- embryos at 48, 72, and 96 hpf; 48 hpf: WT (n=20), nr2f1a-/- (n=6) 72 hpf: WT (n=12), nr2f1a-/- (n=7) 96 hpf: WT (n=11), nr2f1a-/- (n=14). Differences between WT and nr2f1a-/- analyzed using ANOVA with multiple comparisons. Error bars in all graphs indicate s.e.m. *p=0.05–0.001, **p<0.001.
Atrial cardiomyocytes (ACs) in nr2f1a mutants function as pacemaker cardiomyocytes (PCs).