
|
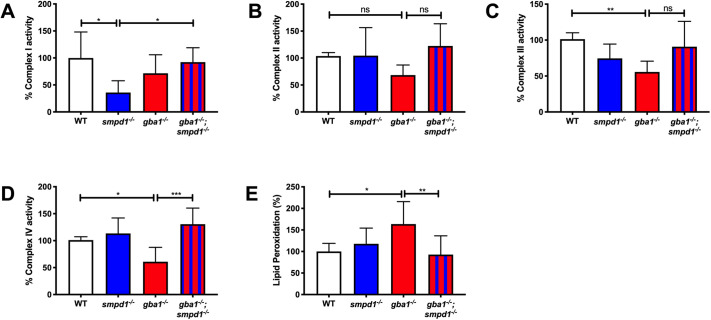
Fig. 6.
Mitochondrial respiratory chain function and lipid peroxidation. (A) Complex I activity was reduced in smpd1−/− by 64±34.77% (mean±s.d.) compared to that in WT (P=0.0198). Complex I activity was normalised in gba1−/−;smpd1−/− with an increase of 56±21.9% compared to that in smpd1−/− (P=0.0445). (B) Complex II activity was similar across the different genotypes (P>0.05). (C) Complex III activity was reduced in gba1−/− compared to that in WT by 45±14.99% (P=0.0091) and increased by 35±35.2% in gba1−/−;smpd1−/− compared to that in gba1−/−, but this did not reach significance (P>0.05). (D) Complex IV activity was reduced in gba1−/− by 40±26.79% compared to that in WT (P=0.0491), but completely rescued in gba1−/−;smpd1−/− double mutants with an increase of 69±26.79% compared to that in gba1−/− (P=0.0005). For all mitochondrial complex activity measurements, six brains were used for each genotype. (E) Mitochondrial lipid peroxidation levels were increased by 63±51% in gba1−/− compared to those in WT (P=0.0214), but reduced by 71±43.48% compared to those in gba1−/− and thus effectively normalised to WT levels in gba1−/−;smpd1−/− double mutants (P=0.0094). For lipid peroxidation experiments, n=6-8 zebrafish bodies were used for each genotype. Significance in both mitochondrial respiratory chain assays and analyses of lipid peroxidation levels was determined by two-way ANOVA with Tukey's multiple comparison test using 12-week-old brain material. Data represented are the mean±s.d. ns, not significant; *P<0.05; **P<0.01; ***P<0.001.