
|
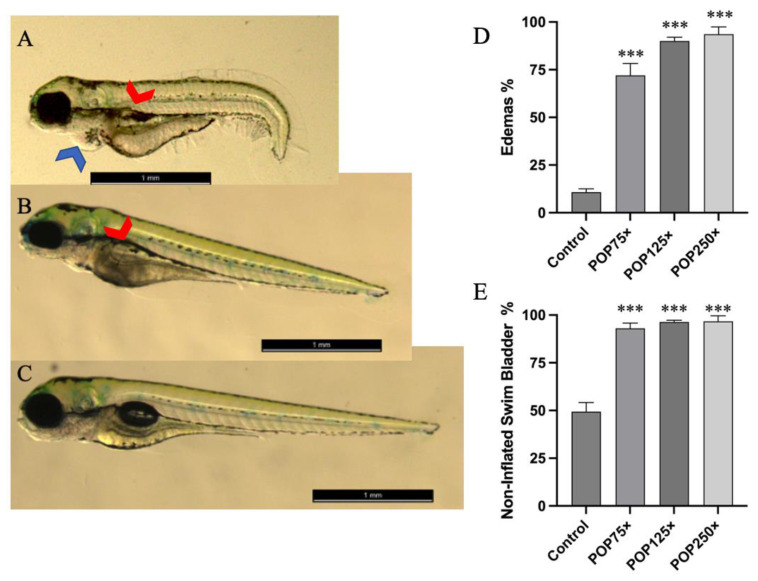
Figure 2
Examples of fish treated and untreated with the POP mix. Several malformations and size differences are striking. Pictures were cropped purposefully to enhance the differences found. (A) Fish treated with POP250x, red arrow pointing at the non-inflated swim bladder, blue arrow pointing at a pericardial edema. (B) Fish treated with POP125×. (C) Control, size bar = 1 mm. (D) Edema, as percentage of the population having this malformation. (E) Non-inflated swim bladder at 96 hpf, as percentage of population. Data presented as mean percentage of population having either malformation and standard deviation; ordinary one-way ANOVA and Tukey’s multiple comparison test, n = 100, p ≤ 0.001 (***).