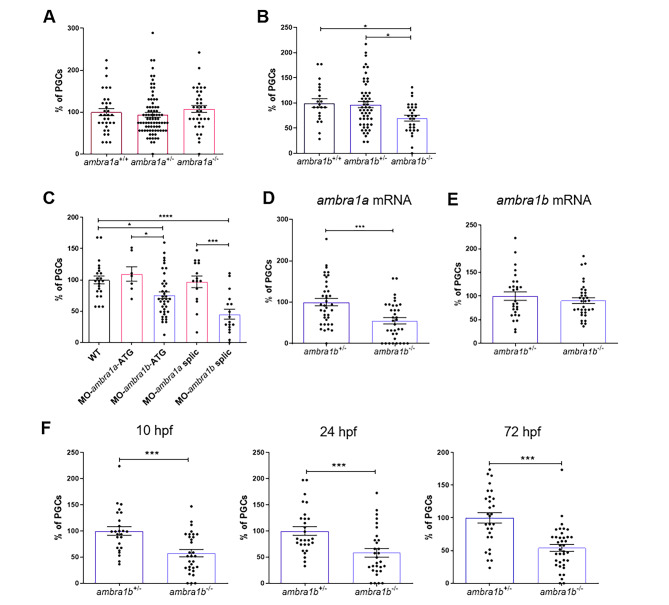
Fig. 3
KO of ambra1b leads to decreased PGC number. (A, B) Quantification of PGCs in 10-hpf embryos of ambra1a (A), ambra1b (B) genotypes, expressed as percentage of PGCs in heterozygous and homozygous siblings compared to their WT controls. Histograms show data pooled together from three independent experiments. Only ambra1b−/− embryos show significant reduction of PGC number (ambra1a+/+ n = 36, ambra1a+/− n = 78, ambra1a−/− n = 35; ambra1b+/+ n = 21, ambra1b+/− n = 54, ambra1b−/− n = 29). Statistical analysis was performed using One way ANOVA. *, P < 0.05. (C) Percentage of PGCs in WT embryos injected with ambra1a or ambra1b ATG MOs or splicing MOs. Analysis was performed at 10 hpf by immunohistochemistry for Vasa protein. ambra1b knockdown performed with both types of MO results in a significant reduction of PGCs. Histograms show data pooled together from three independent experiments (WT n = 23, MO-ambra1a-ATG n = 14, MO-ambra1b-ATG n = 41, MO-ambra1a-splic n = 20, MO-ambra1b-splic n = 20). Statistical analysis was performed using One way ANOVA. *, P < 0.05; ** P < 0.01; *** P < 0.001; **** P < 0.0001. (D, E) Results of rescue experiments by co-injection of GFP-nos1-3’UTR mRNA with ambra1a or ambra1b mRNA, respectively. PGC number is expressed as percentage with respect to ambra1b+/− animals, in which the PGC number was settled as 100%. Histograms show data pooled together from three independent experiments (D: ambra1b+/− n = 38, ambra1b−/− n = 35; E: ambra1b+/− n = 28, ambra1b−/− n = 34). Statistical analysis was performed using Student’s t-test. *** P < 0.001. (F) Quantification of PGC number in ambra1b+/− and ambra1b−/− embryos at 10, 24,72 hpf after injection with GFP-nos1-3’UTR mRNA. Number of PGCs in controls (ambra1b+/−) was settled as 100%. Histograms show data pooled together from three independent experiments (10 hpf: ambra1b+/− n = 25, ambra1b−/− n = 31; 24 hpf: ambra1b+/− n = 28, ambra1b−/− n = 30; 72 hpf: ambra1b+/− n = 29, ambra1b−/− n = 38). Statistical analysis was performed using Student’s t-test. *** P < 0.001. Error bars indicate SEM.

