
Image
|
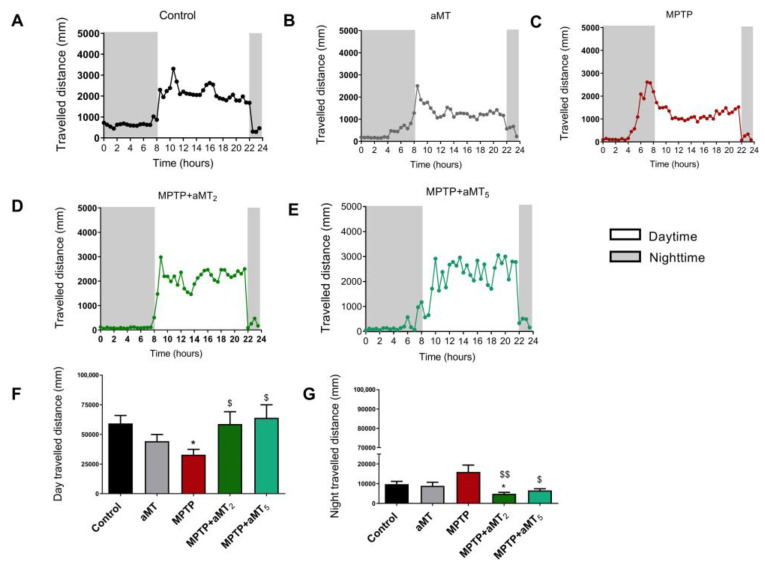
Figure Caption
Figure 3
Total distance traveled during 24 h by zebrafish embryos. The light and dark conditions (shaded part) are 14:10 h, respectively. (A) control rhythm; (B) aMT group; (C) MPTP group; (D) MPTP+aMT2 group; (E) MPTP+aMT5 group; (F) total day travelled distance; and (G) total night travelled distance. Data are presented as mean ± SEM. * p < 0.05 vs. control; $ p < 0.05 vs. MPTP; $$ p < 0.01 vs. MPTP. Unpaired t test.
Figure Data
Acknowledgments
This image is the copyrighted work of the attributed author or publisher, and
ZFIN has permission only to display this image to its users.
Additional permissions should be obtained from the applicable author or publisher of the image.
Full text @ Antioxidants (Basel)