
|
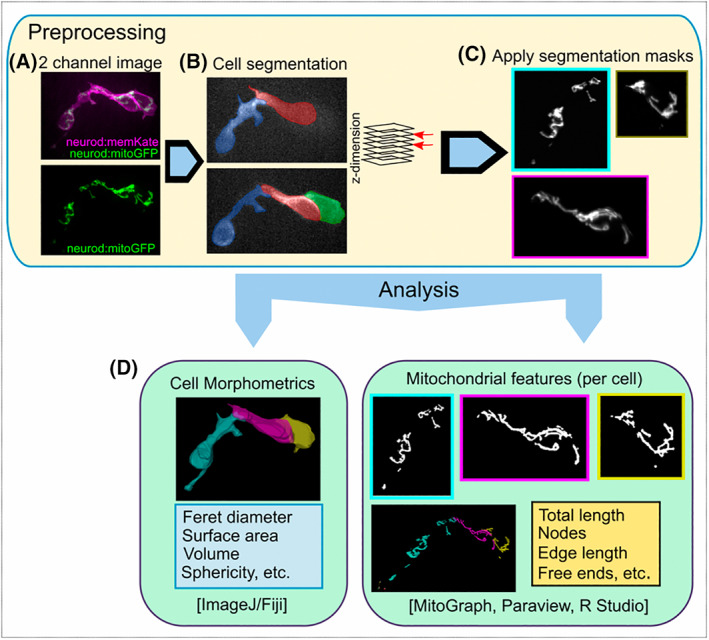
Fig. 3
Segmentation of mitochondria in clustering cells. (A) Expression of neurod:memKate in addition to neurod:mitoGFP facilitates segmentation of mitochondria in adjoining cells. Closely opposed mitochondria cannot be assigned to specific cells based on neurod:mitoGFP expression alone (A, bottom). (B) Cell segmentation, shown in two different z‐planes, based on the membrane‐localised memKate signal. (C) By using cell segmentation masks, mitochondria from each cell can be separated. (D) Quantitative analysis of single cell morphology (left) and the corresponding mitochondrial network (right) using open‐source software.