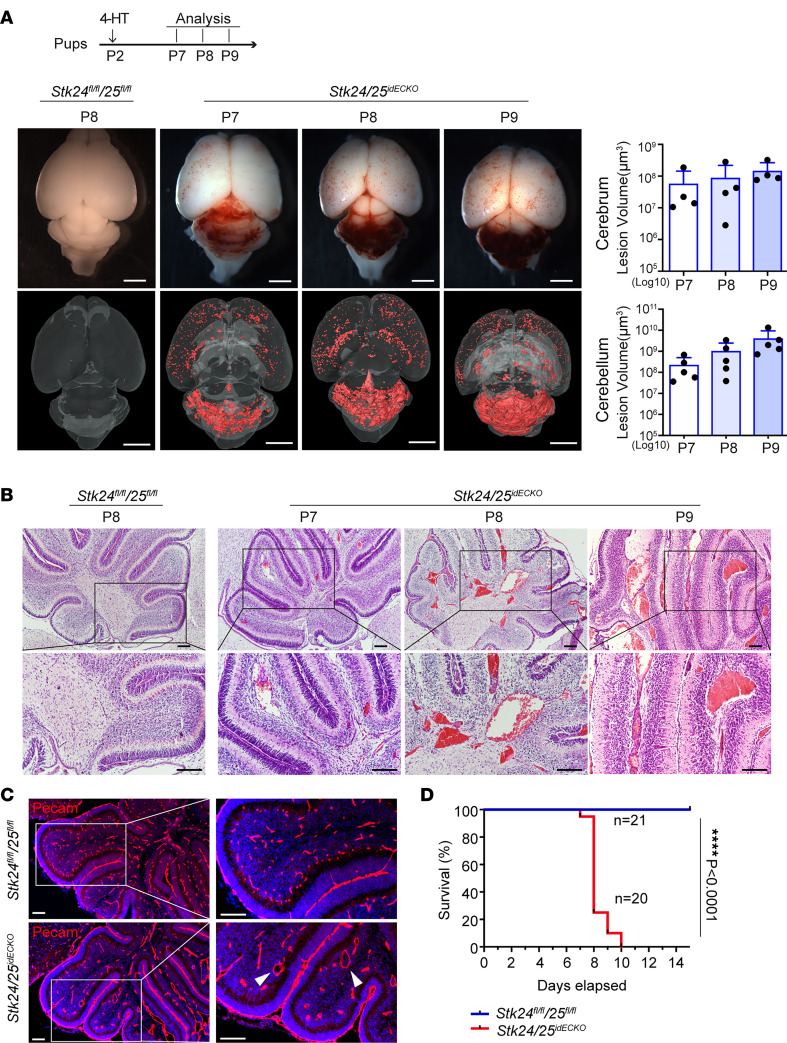
Figure 3
(A) Schematic of 4-hydroxytamoxifen (HT) injection and sample collection. Pups were intragastrically injected with 4-HT at P2, and the brain tissues were harvested at specific time points (P7, P8, and P9). Stereomicroscopic images and μCT images of CCM lesions in control and the Stk24/25idECKO mice at P7, P8, and P9. Scale bars: 2 mm. Quantitative analysis of lesion volume in the cerebrum (n = 4) and cerebellum (n = 5) in the Stk24/25idECKO mice is shown on the right. Data in the quantitative plots are presented as mean ± SD. (B) H&E staining of brain sections in Stk24fl/flStk25fl/fl mice (n = 3) at P8 and Stk24/25idECKO mice (n = 3) at P7, P8, and P9. CCM lesions are shown as red masses. Scale bars: 100 μm. (C) Immunostainings of Pecam show cavernomas and reduced vascular number in Stk24/25idECKO mice (n = 4) compared with Stk24fl/fl;Stk25fl/fl mice (n = 4). The white arrowheads indicate malformed vessels. Scale bars: 50 μm. (D) The survival curve of Stk24/25idECKO (n = 20) and Stk24fl/fl;Stk25fl/fl (n = 21) mice after 4-HT induction at P2. Statistical analysis was performed using the Mantel-Cox test. ****P < 0.0001. Representative images from at least 3 or more independent experiments are shown.

