
|
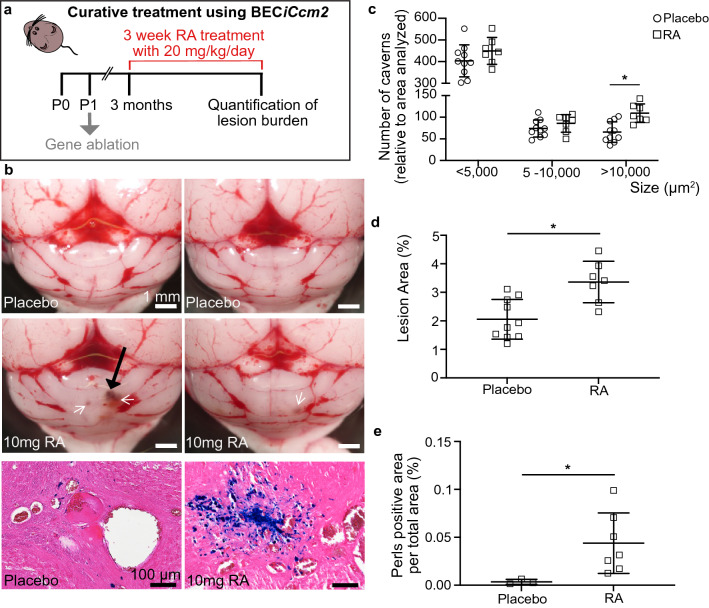
Figure 3
Curative RA trial in BECiCcm2 mice. (a) Treatment regimen with brain-endothelial-cell-specific gene ablation at P1 followed by RA treatment at three months of age for a period of 3 weeks (10 mg containing pellets with a release of ~ 20 mg/kg/day for 21 days). (b) Extracted BECiCcm2 mouse brains after treatment. Upper: placebo treated controls. Middle: brains after 10 mg of RA treatment. Black arrows indicating hemorrhage, white arrows pointing at visible lesions. Lower: histological sections of cerebral cavernous malformation (CCM) lesions after treatment. Perls blue stain reveals non-heme iron deposition. Scale bars: 1 mm (upper and middle); 100 µm (lower). (c) Quantification of lesion burden in cerebella of placebo versus 10 mg RA treated mice. Lesions are quantified in three groups according to their size. Each datapoint represents one animal. Error bars represent mean with SD. (d) Quantification of lesion area as percentage of total area analyzed (*P < 0.05). (e) Quantification of Perls blue staining positive area per total area analyzed (*P < 0.05; **P < 0.01). Error bars represent mean with SD.