
Image
|
Figure Caption
Figure 2
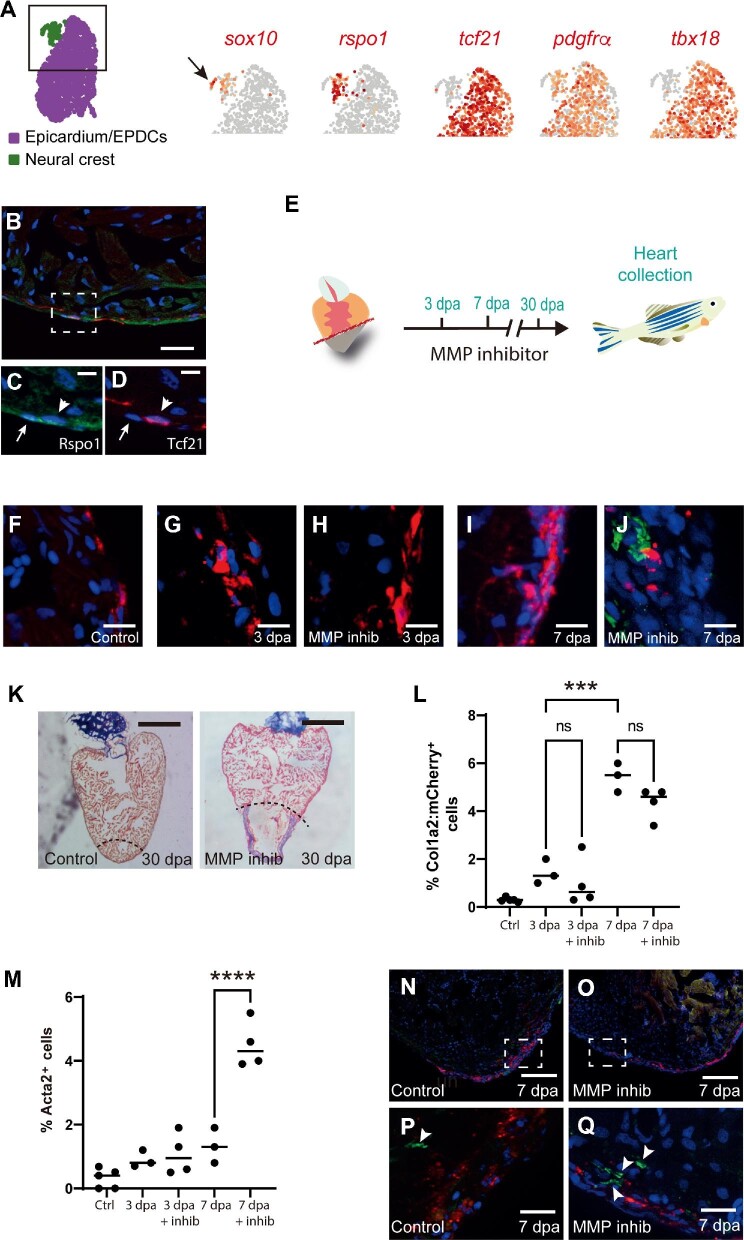
Mesenchymal lineages and cardiac fibroblast activation in the regenerating zebrafish heart. (A) UMAP plot indicates the epicardial (purple) and neural crest (green) clusters. The black square delineates the area depicted in the subsequent UMAP plots. UMAP plots depict the relative expression of sox10 (neural crest; the black arrow indicates the neural crest cluster), rspo1, tcf21 (epicardium/EPDCs),
Acknowledgments
This image is the copyrighted work of the attributed author or publisher, and
ZFIN has permission only to display this image to its users.
Additional permissions should be obtained from the applicable author or publisher of the image.
Full text @ J. Mol. Cell Biol.