
|
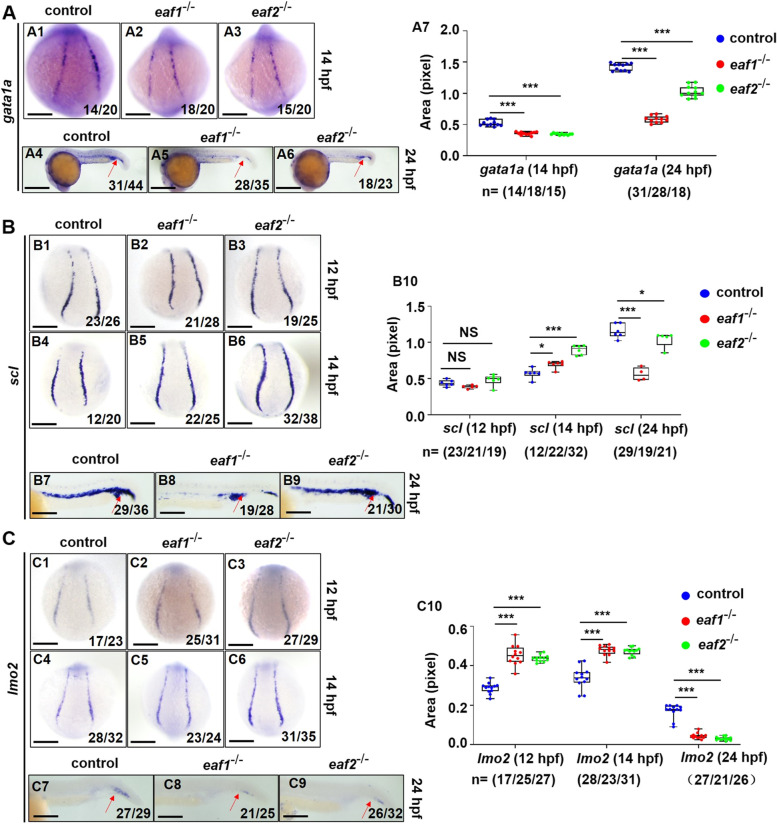
Fig. 4
Effects of eaf1/2 deficiency on the expression of erythrogenesis transcriptional factors. A WISH analysis of the expression of erythrogenesis transcriptional factor gata1a in eaf1−/−, eaf2−/−, and WT embryos at 14 hpf (A1-A3) and 24 hpf (A4-A6), and statistical analysis of gata1a staining results (A7). B WISH analysis of the expression of erythrogenesis transcriptional factor scl in eaf1−/−, eaf2−/−, and WT embryos (B1-B6) at 12/14 hpf and 24 hpf (B7-B9), and statistical analysis of scl staining results (B10). C WISH analysis of the expression of erythrogenesis transcriptional factor lmo2 in eaf1−/−, eaf2−/−, and WT embryos at 12/14 hpf (C1-C6) and at 24 hpf (C7-C9). (C10) Statistical analysis of lmo2 staining results. Each experiment was repeated at least three times, with similar results for two or three replicates, and a representative result was shown. Data are mean ± SD. A1-A3, B1-B6, C1-C6, dorsal view, anterior to the up; A4-A6, B7-B9, C7-C9, lateral view, anterior to the left. *P < .05, **P < .01, ***P < .001. NS, not significant. Scale bar = 75 μm (A1-A3, B1-B6, C1-C6), 200 μm (A4-A6), and 50 μm (B7-B9, C7-C9)